 12 min read


Growing your site’s traffic is very crucial for the success of your venture. If you manage to have a steady flow of visitors to your page, you are more likely to attract potential customers. To achieve this, you need to be able to analyze your site’s performance.
Besides, you need to understand how your site visitors interact with your page. With this information, you can adjust your strategies to attract more people. Google analytic app is a free tool that can positively transform your online marketing strategy. Keep reading to gain more insight.
How Google Analytics Works
The app works along with other platforms like Google Ads and Search Console to give you an in-depth look at your site performance. After signing up for the account, you install a tracking code on each of your pages on your site. The code then collects information relating to user interactions on your page. After this, the data get systematized and delivered to your reports.
How To Set Up A Google Analytics Account
It’s worth noting that you can only access Google Analytics if you have an active Google account. If you have one, then sign in to set up the Analytics account. Log in, then click Admin in the navigation bar. Proceed to the list of properties and choose ‘create a new one. ‘Select the account you want to add your property to and indicate that you want to track data from a mobile app. Remember to give the property a name, set up a time zone, and your operations industry to finish this step.
Next, you can add a view to your property. Through the menu, create a view, name it, and answer some questions. Note that you can include up to 25 of them to a property in Google analytics. Further, you need to get your tracking ID so you can access data on your property. At this step, Google suggests that you download Google analytics SDK for IOS and Android then add them to your application. The image below shows how to create a new view:
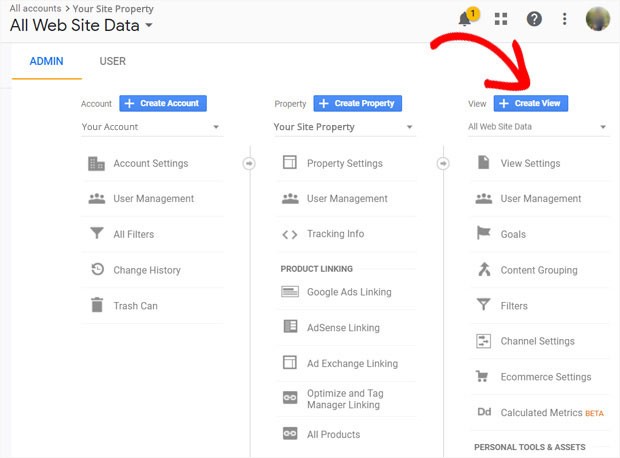
(Image Credit: MonsterInsights)
Verify your account by posting the code in the designated area at the external tools menu. Next, turn on the campaign tracking section, click save to publish the modification, and update your Google analytics native app with the new codes. It will help to verify that the code is in working conditions. Look at the real-time report area while you click on your site through your phone on a different tab. It should show at least a single visitor, that is you.
What To Track With Google Analytics
Analytics Google mobile helps you understand what works for your page and what doesn’t. Therefore, you will know where you need to concentrate on more and identify anything that may affect your success. With this useful tool, you can measure various metrics, which includes;
Events
Events mean users’ interaction with a specific element of your site. It covers things like menu selection, swipes, video plays, download, button presses, among others. You need to enable tracking within your account using various parameters to track events on a specific element. The category section will help you organize your events into groups. On the other hand, the value parameter gives you numerical variables to collect customized data. Further, action describes the event as labels expound on the element you are tracking.
From the report, you can get various information, including the number of unique events, screens that users frequently interact with, and those they don’t. However, you must set up event tracking separately if you wish to measure different elements within a screen. Carefully name the parameters to ensure that your data displays in the right manner. Understand your objectives and only use the parameters that will help you achieve the goals. For example:
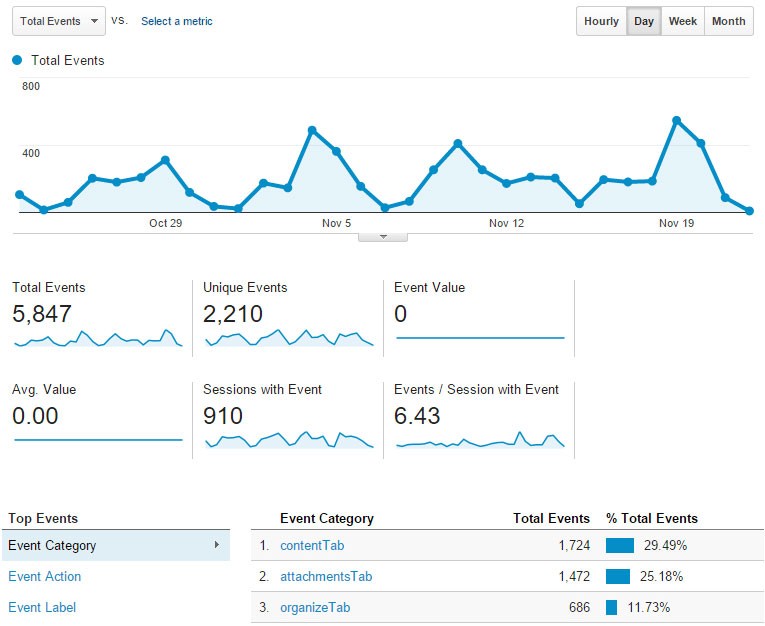
(Image Credit: Wakefly)
Ecommerce Tracking
If you use your website to sell products or services, you can measure a particular item’s performance and activities. Besides, you can get crucial data on your customers’ behavior and monitor the entire purchase process. You obtain vital information like the number of purchase transactions and the average cost, among others.
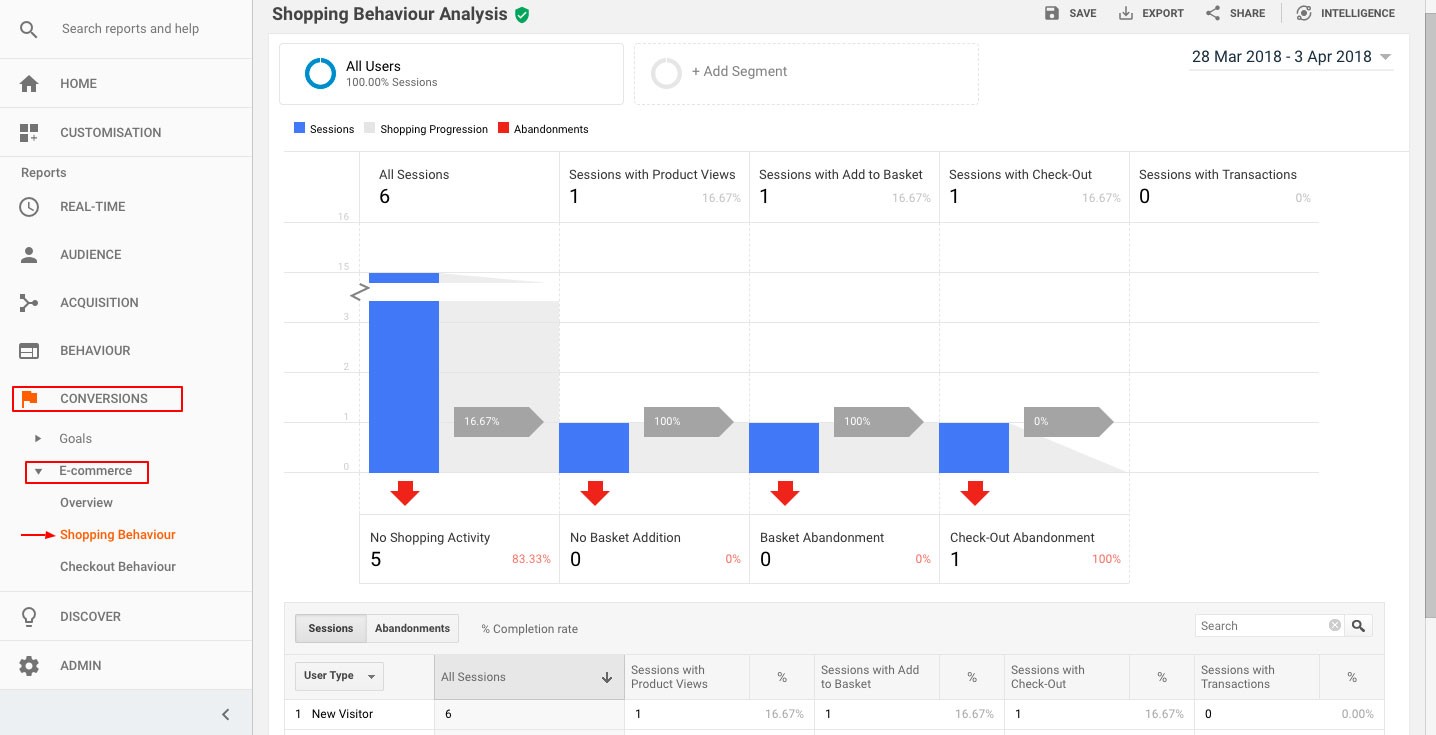
Additionally, you can filter the results based on the category, brand, or product names. Using the shopping and checkout behaviors, you will know how many customers viewed a particular product and left, and how many purchased. Further, you can see the returning clients and their geographical locations to segment your marketing strategies better. For instance:
You Might Also Like
(Image Credit: X-Cart)
Moreover, the product list performance report will let you know the most popular products, which sell better and the revenue collected from each sale. With that information, you can, therefore, learn more about your items. For instance if a particular item sells more, you can contact your vendor to ensure constant supply so that it doesn’t run out. On the other hand, if your users prefer a specific item color over another, you can add more of the desired item models.
Also, you get more aware of the shipping costs, taxes, and the total profit gained from each transaction. You will be able to track your customers’ journey from the first time they interacted with your site and the path they took before purchase. From this data, you will know the essential steps that determine the purchase process. To set up this tracking, proceed to the Admin, view, then e-commerce settings, and enable ‘e-commerce status’ and ‘related products.’ If you want to see your customers’ shopping activities, permit enhanced ecommerce reporting.
Screen Tracking
The Google analytics mobile also helps you determine which screens your customer visits within your webpage. You will discover the most popular screens and how much time your site visitors spend on each. Besides, you can monitor their movement and how often they purchase from a particular screen. The information helps you know which content attracts more people and what items perform better. For example:
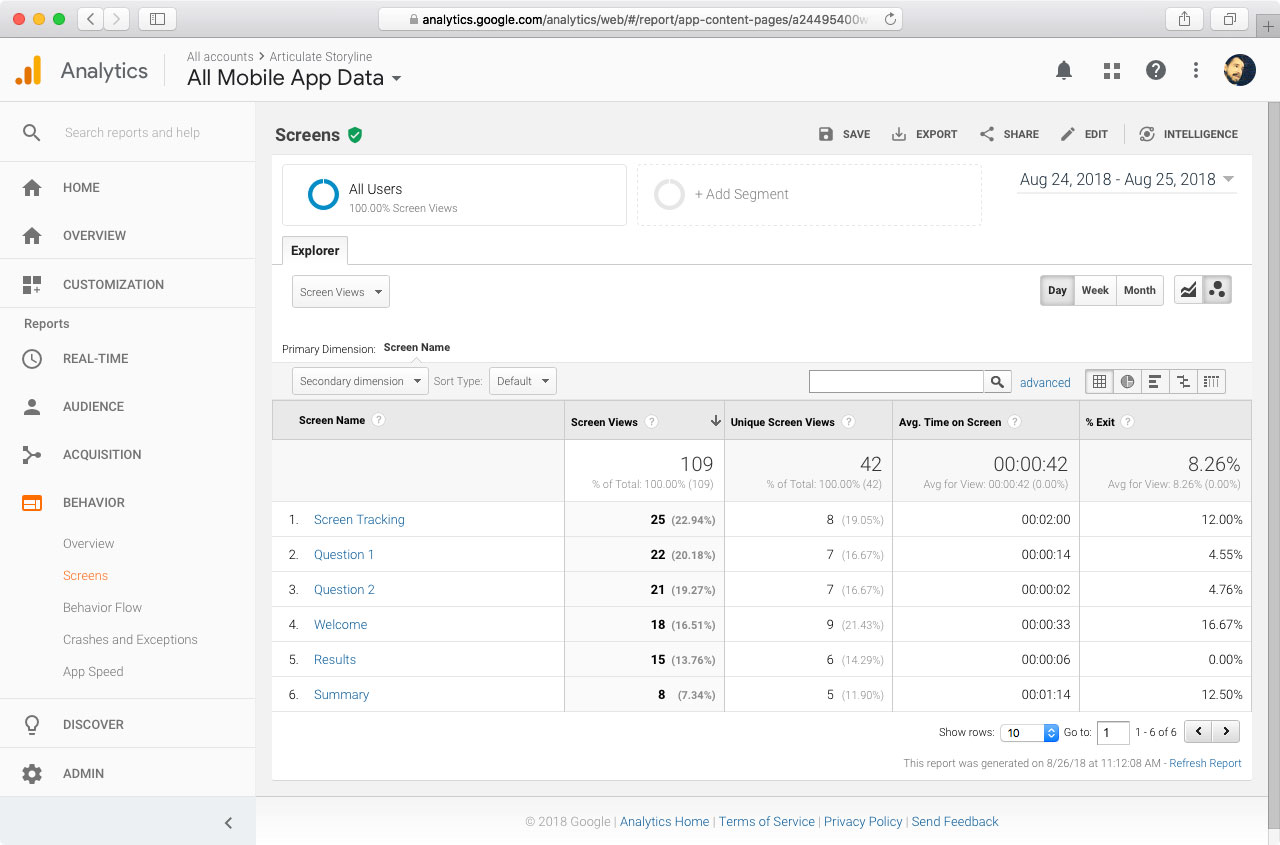
(Image Credit: Steven Westmoreland)
Yet, it would be wise to use multiple screens instead of displaying all this content in a single one. By doing this, you can monitor user progress efficiently. You can tell when they drop off a particular screen, which calls for further inspection. The information collected from this tracking will help you determine where to place your ads. Position them where users spend most of their time.
Understand your Google Analytics + test your SEO in 60 seconds!
Diib easily syncs with Google Analytics and then uses the power of big data to help you quickly and easily increase your traffic and rankings. We’ll even let you know if you already deserve to rank higher for certain keywords. As seen in Entrepreneur!
- Easy-to-use automated SEO tool
- Keyword and backlink monitoring + ideas
- Speed, security, + Core Vitals tracking
- Intelligently suggests ideas to improve SEO
- Over 500,000 global members
- Built-in benchmarking and competitor analysis
Used by over 500k companies and organizations:
Syncs with 

Why You Need Google Analytics
Google analytics has many functions, but mainly it gives you metrics concerning your website visitors and overall performance. With these insights, you can make the best business decisions in the future. Even better, it avails automated results, beneficial for busy website owners who have limited time to collect data. These tools have too much to offer, and you may need it for the following purposes.
To Understand How Users Find Your Webpage
The Google Analytics app helps you trace user interaction with both your mobile app and website. You can, therefore, learn what exactly brought people to your site. It could be from referring websites links, advertisement efforts, social shares, or even search results. From this data, you will thus determine what best suits your venture. You can then readjust your campaigns accordingly to attract more customers.
To Know Which Marketing Campaigns Triggers Higher Engagement
Google Analytics mobile app data gives you a clear picture of how users navigate through your site. Besides, you can determine the marketing channels that result in higher conversions or sales. You will also know which notifications trigger more engagement. With the data, you can compare your campaign efforts and choose those that will help increase your revenue in the end. To Determine Which Items Users Viewed Most
Google Analytics for mobile apps lets you know which products interest your target customers more. You should thus pay attention to these items to increase conversions. Additionally, it will help determine the best-selling item and why they perform that good. With these details, you should set up an informed campaign to further boost revenue.
To Know Your Customers Better
Using Google Analytics, you can examine vital information about your target customers. You will know what they like, their age, how often they use your items, and even their geographical location. Hence, you can optimize the site and target your advertisements appropriately. The app lets you know of the number of new users who visited your page for a particular period. Also, you can tabulate the amount of revenue derived from each user over a specific time.
Moreover, you will know more about cohort behaviors. These are merely segments of your target customers who depict similar characteristics. You can thus spot various behavioral patterns in different groups of your item users. As a result, you will target your ads more accurately while paying more attention to a specific group.
It also helps you to interact with your customers effectively. For instance, if you notice that a particular group didn’t make a repeat purchase, you can send them a push message and include a promo offer.
Track statistics In Google Analytics Mobile App
Even if you manage multiple accounts, you can easily navigate the view and properties from your Google Analytics homepage or the account interface. It’s worth noting that you view your Google analytics mobile app data in both dimensions and metrics.
Dimensions include location, landing pages, customer type, and browser, and they appear in rows. On the other hand, bounce rates, sessions, and page views fall in metrics that are in columns.
You begin by logging into your Google Analytics native app, find your site in the series of folders, and click on it. On the dashboard, you will find the home, customization, Admin, and reporting tabs.
Total Statistics
By a mere glance on the home tab, you can easily see the total stats, but you will need to navigate the tabs for more details. If you have various accounts, at this point, you can see a list of them, so you choose which reports you want to see. From the tab, you can see the sessions that provide an overview of your site’s various interactions in a specific timeframe. Additionally, the home tab displays the bounce rate where you will spot the number of users who left your page after visiting for a short time. Further, you can also see the goal conversion rate to determine the number of users who took the desired actions on each website you own.
On the left side of your account, you will find a list of reports that further expounds on the data across your website. It’s at this tab where you will know how well or lower your site performs to make the necessary adjustments.
Real-time Reports
The real-time reports will show you the exact happenings of your site at that particular moment. You can determine the number of active viewers, the amount of traffic generated from your recent content, the top keywords searched for, and the most active pages. Additionally, you will know whether your current sales or events derive views. Here is an example of a real-time report with Google Analytics:
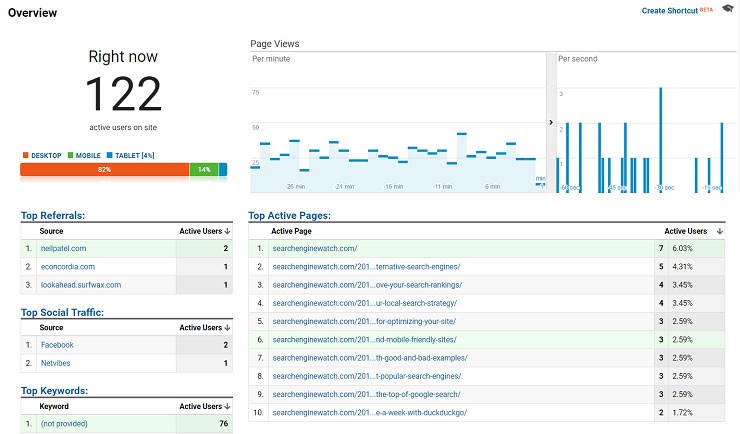
(Image Credit: Search Engine Watch)
In the audience report section, you can view all information about your site visitors. It lets you know the visitors’ location, the operating system or browser they are using, their interests, demographics, and behaviors. The data will help you better understand your target customers to make informed adjustments. For instance, if you notice that you gain vast traffic from desktops, you may need to improve your mobile application’s website.
Acquisition Report
The acquisition report in the Google Analytics app gives you an overview of how your site visitors get to your website. It could be organic traffic from Google and other search engines. Additionally, you might get users directly when an individual types in your page URL. On the other hand, you may gain visitors from referrals when another site links to your page.
Other sites attract users from an email list, social media platform, affiliate links, or paid advertisements. Still, display traffic occurs when people visit your page from the displayed ads. If Google analytics can’t categorize your traffic source, you will see this in the ‘others’ section. For instance:
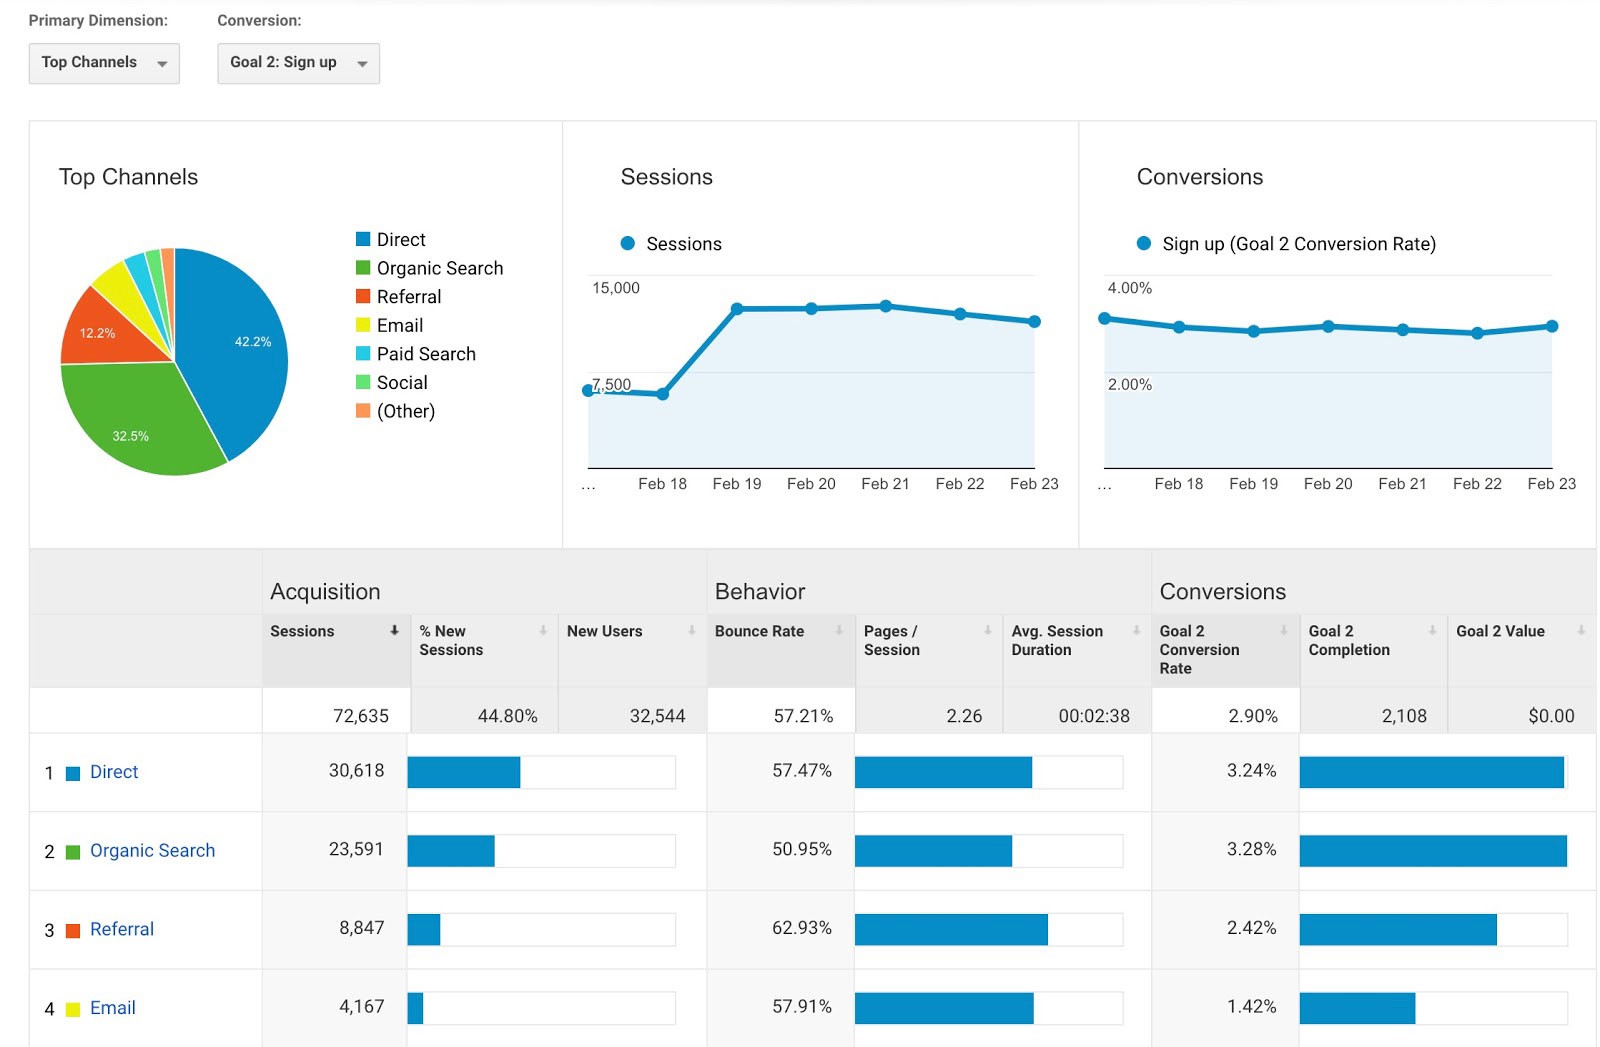
(Image Credit: SEO Site Checkup)
Behavior Report Segment
From the behavior report segment, you will see how the users interact with your site. You can focus on individual reports for various pages to find out which content performs better. Further, it helps you determine unique page views, average time spent on each page, the exit, and bounce rates. Moreover, you can assess how your content performs by titles, search terms, URLs, or events.
Conversion Report
In the conversion reports, you can see how your visitor turns into customers on your website. Your conversion goal may differ depending on the type of site you run. The main objectives are destination, events, duration, and page per session.
We hope that you found this article useful.
If you want to know more interesting about your site health, get personal recommendations and alerts, scan your website by Diib. It only takes 60 seconds.
You achieve the destination goal when users get to a specific place like your product site. For the duration, it’s when your users take enough time on your page.
On the other hand, you accomplish the event goal when a predetermined action occurs, like sharing a link on social media. The screen per session is whereby your views go through several pages on your website in a particular session.
For instance, in an e-commerce site, look out for the number of orders. Your main aim is to make users stay longer on your site to improve your ad revenue for a blogger. You might also want to attract visitors to sign up for your email list to keep them informed of your brand. Irrespective of your goal, the analytic Google apps will let you measure your conversion rates. The image below is an example of Google Analytics’ real-time conversion report:
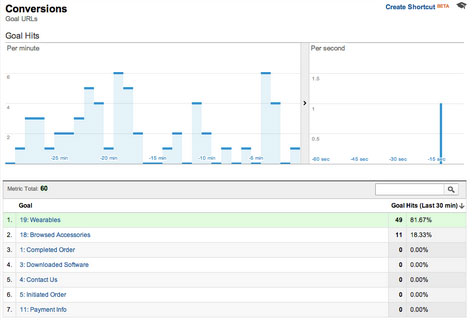
(Image Credit: Search Engine Watch)
Customization Tab
The customization tab enables you to track your personalized reports based on your needs. You can make as many reports as you want and access them quickly through the section. If you want to create a custom report, select the metric you want to measure, and you can even pick more than one dimension. For instance, you can decide to simultaneously measure your page views, countries, or bounce rate.
Admin Tab
From the admin tab, you can manage your account and switch from one to another if you have multiple sites. In this section, you can also choose the exact website you want to view reports for. Still, you can link your Google analytics with your AdSense or AdWords accounts at the tab to further measure your marketing campaign’s effectiveness. This section also allows you to add more user segments, schedule your emails, or even set up your alerts. For example:
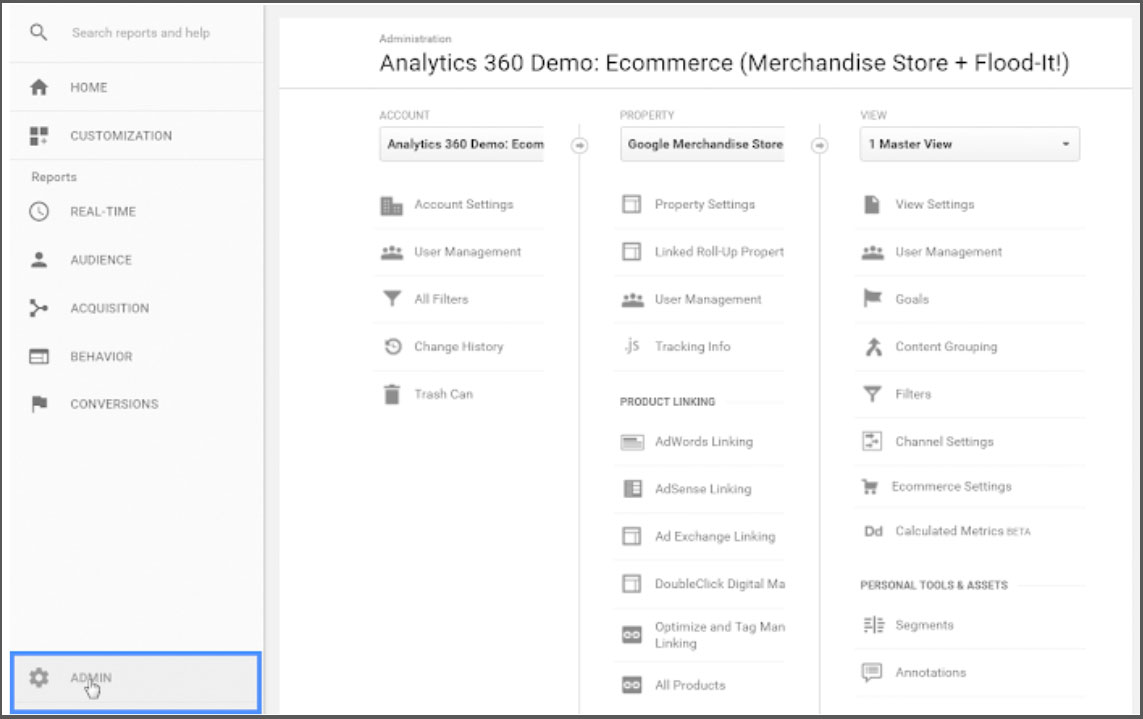
(Image Credit: Google Support)
Filters
Always use filters to find quick access to your reports and save on time. It helps you break down your contact into smaller groups, and you can even exclude specific data or even plan for quick access to most used reports.
Diib®: Monitor Your Mobile App Google Analytics
The above guide aims at giving you the fundamentals of analytics Google mobile to help you make a smart business decision based on accurate data. Diib Digital can offer an added measure of protection that you’re getting the statistics and customization right. Our User Dashboard will give you vital statistics and metrics that will allow you to tweak your GA mobile app to best fit your needs. Here are some of the features you’ll love:
- Bounce rate monitoring and repair
- Social media integration and performance
- Broken pages where you have backlinks (404 checker)
- Keyword, backlink, and indexing monitoring and tracking tools
- User experience and mobile speed optimization
- Technical SEO monitoring, including your GA mobile app
Click here for your free scan or simply call 800-303-3510 to speak to one of our growth experts.
FAQ’s
Google Analytics for your mobile apps can give you vital information on your mobile users. There are reports designed with app developers in mind. You can measure your in-app payments and revenue and customize reports for the best outcomes.
Yes, your own visits will count in your Google Analytics tally. In most cases, however, you won’t notice these as they simply blend in with the rest.
Google Analytics is a free service. You will, however, pay for the plugins you use to organize and perform the programming side of your website or for more advanced features.
While IP addresses are collected by Google Analytics, they will not show up in any reports or to any end users.
Google Analytics can be difficult to navigate and understand for the novice. You need to learn to read the metrics and understand the basics before moving on to the more advanced metrics.


One thought on “Google Analytics For Mobile Apps: Set Up And Tracking”