 14 min read


Nearly two-thirds of millennials report making over half of their purchasing decisions online. Even if they prefer to buy in-store, most people discover new brands through online marketing campaigns.
More than ever before in history, we conduct a huge percentage of our lives online. We shop online. We discover businesses online. And, yes, we make a large chunk of our social interactions online.
Everyone from small business owners to megacorporate entities, independent creators, and freelancers need to optimize their digital presence. A big part means curating one’s impact through data analytics.
So, what is audience analytics? Audience analytics is the art of processing raw, unfiltered data to discover trends about site visitors and clients. Through web analytics, site owners can better understand their core audience’s wants, interests, and beliefs. Here is an example:
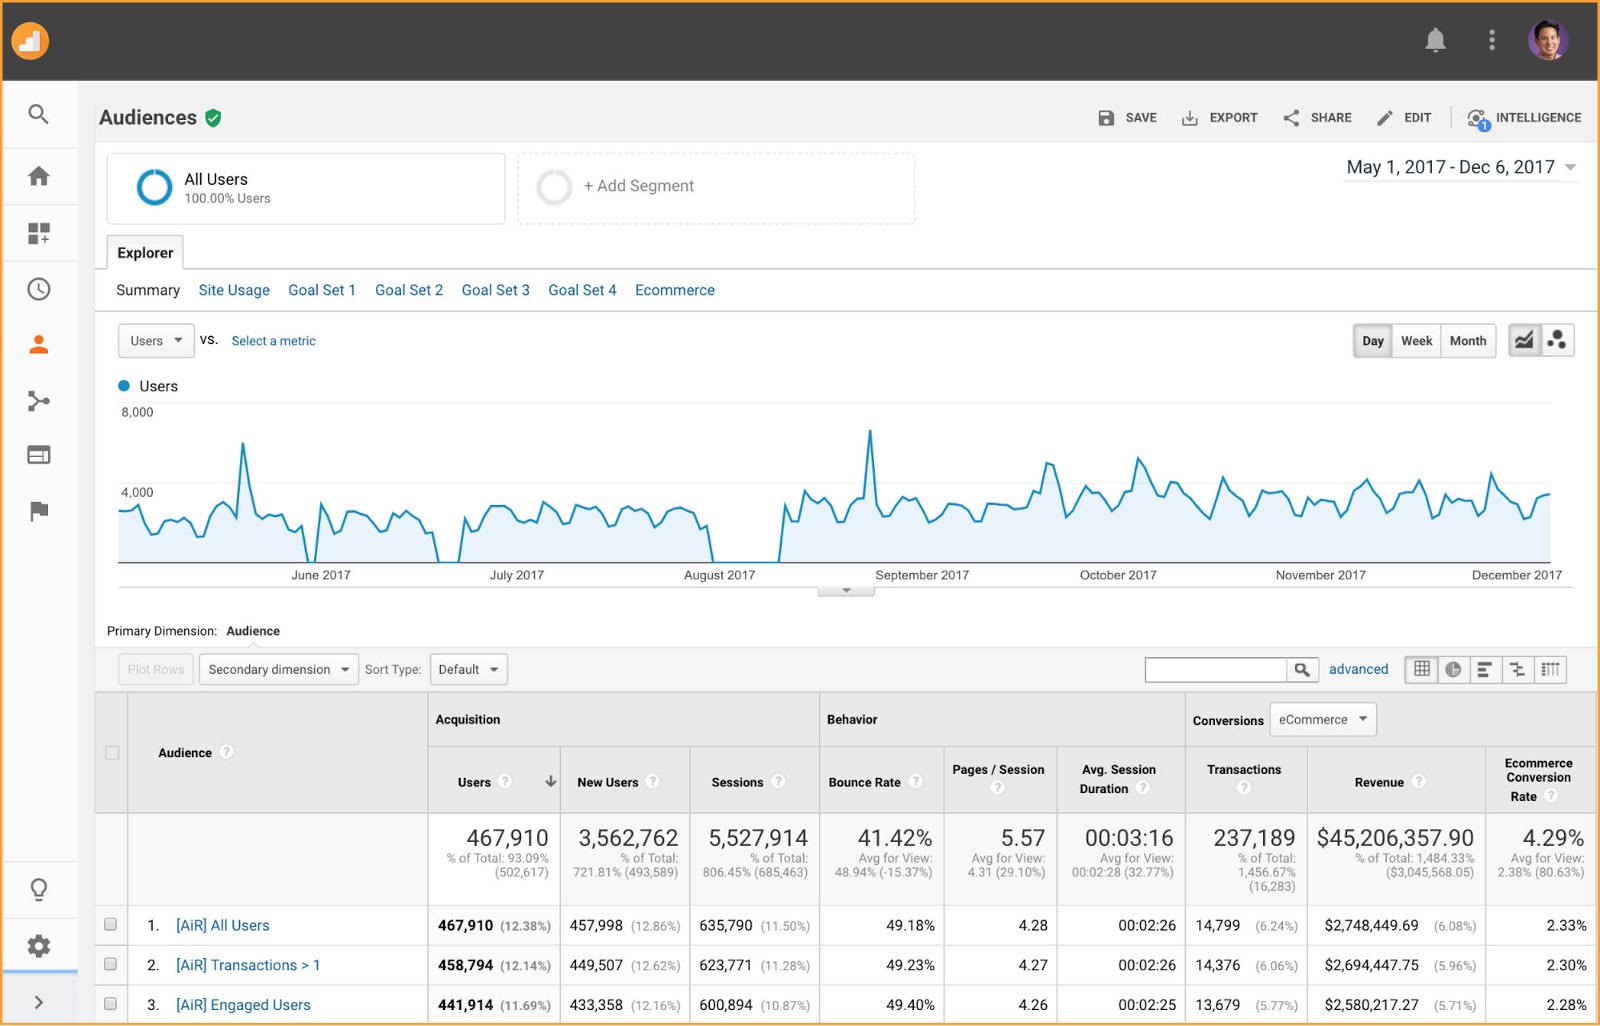
It’s not enough to rely on hear-say or anecdote anymore. Right at their fingertips, site owners can tap into powerful demographic and behavioral information concerning their clients.
Want to become competitive? You’ll need to use services like Google Analytics to their fullest potential.
Below, we’ll touch on what Google Analytics is, why it’s useful, and how to get started with your new GA account. Then, we’ll deep-dive into the best strategies to squeeze the most out of your Google Analytics audience.
What is Google Analytics?
Acquired from Urchin Software Corp. in 2005, Google built on the dual ideas of client demographics and data analytics to develop Google Analytics (GA). Since then, the little-known software application has reigned supreme among site owners that want to understand their audience.
Unlike the bygone analytics apps offered by IBM, WebTrends, and WebSideStory, Google sought to provide a free analytics platform for site owners.
As the years have passed, GA has only gotten more sophisticated and extensible. Late 2009 saw the introduction of a novel AdSense feature, which helped site owners measure site performance and financial return on investment (ROI). For instance:
More recent releases allowed owners to segment site visitors by their demographic information. GA now uses cookie information to gauge unique visitors, returning clients, and clients segregated by location. Faster data visualization and SEO fine-tuning can now be accomplished through a paired-down analytics interface.
Companies and independent entrepreneurs alike rely on web analytics to tailor the products and services they offer. Even marketers regularly rely on GA to design more attention-grabbing ads, webpages, and sites. In such a hugely competitive digital landscape, those that don’t utilize analytics are left behind.
How Popular is Google Analytics?
According to W3Techs, GA is now used by 52.9 percent of all websites in the world – officially, that makes it ten times as popular as the second-most frequented application Yandex Metrics.
Features like real-time reporting, tag management, and event tracking all brought GA to prominence over its fiercest competitors. There’s no time like now to integrate GA tracking to your online platform.
You Might Also Like
How To Set Up Google Analytics for Your Platform
Perhaps Google Analytics is so compelling because it’s easy for even the least technically proficient site owners to set up themselves.
To get started collecting basic site data, you’ll need to connect a GA tracking tag to all of your relevant site pages. As visitors explore your site, their demographic information, clicks, and behavior are all synced with your GA account through the embedded tag.
To get started, follow these simple instructions through Google Analytics:
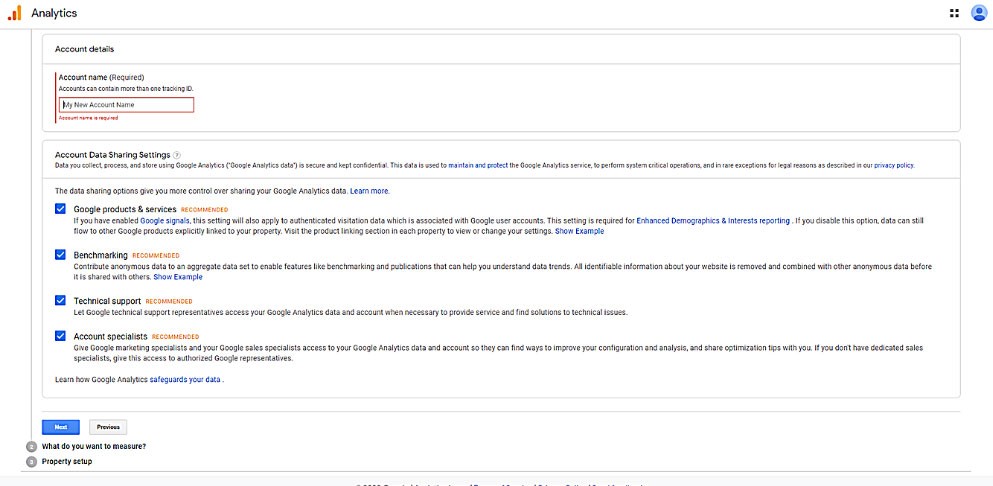
- Create a new Analytics account or log-in to google.com/analytics (Here is what the sign-up page should look like):
- Create a new Property inside your Analytics account, which signifies your unique site or app and serves as the collection point
- Inside your Property, set up a reporting view that lets you filter different data perspectives
- Add the tracking code (GA tag) to your website so that you can start aggregating user data
You can find your tracking code inside the Property tab that represents your site. Your tracking ID is displayed prominently at the top of the tab while the global site tag can be found under Website Tracking > Global Site Tag.
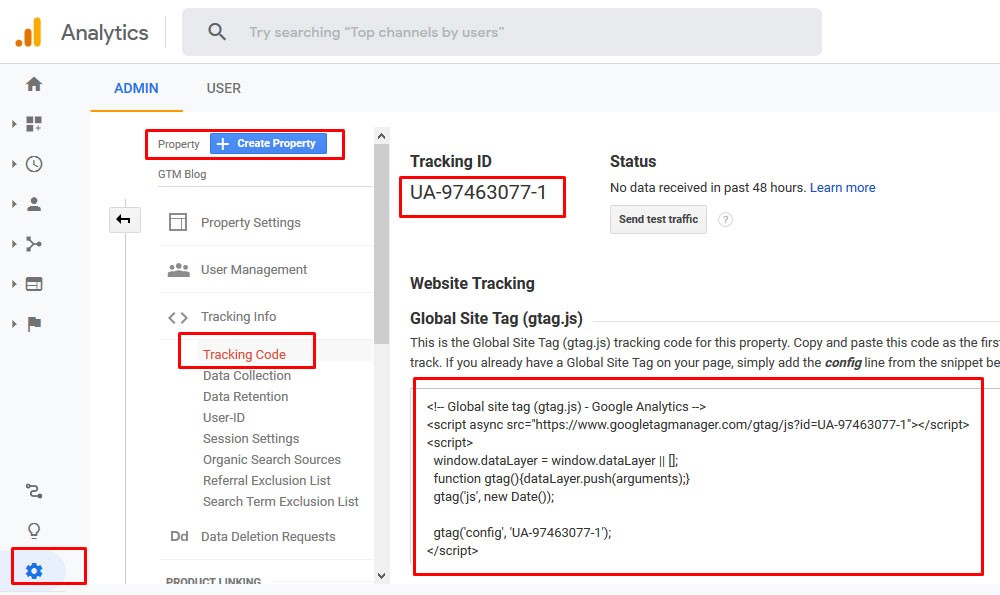
(Image credit: Google Support)
Once you’ve copied your global site tag, you or the development team will need to paste into each web page you’d like to collect data on. The relevant code block can be found right under the Global Site Tag on GA. (Look at the image above for an example.)
How data is collected will differ depending on whether your site is static, dynamic, hosted through an external service, or created with a content management system (CMS). Thankfully, Google provides rich documentation on how to integrate the tracking code with service providers like WordPress, Shopify, GoDaddy, and more.
When in doubt, make sure to reference Google’s Analytics Help that answers most questions within the realm of possibility.
Understand your Google Analytics + test your SEO in 60 seconds!
Diib easily syncs with Google Analytics and then uses the power of big data to help you quickly and easily increase your traffic and rankings. We’ll even let you know if you already deserve to rank higher for certain keywords. As seen in Entrepreneur!
- Easy-to-use automated SEO tool
- Keyword and backlink monitoring + ideas
- Speed, security, + Core Vitals tracking
- Intelligently suggests ideas to improve SEO
- Over 500,000 global members
- Built-in benchmarking and competitor analysis
Used by over 500k companies and organizations:
Syncs with 

The Best Google Analytics Audience Practices
Below, we’ll dive into the most tried-and-true Google Analytics practices for better understanding your website’s clientele. Without a thought-out plan and reporting procedure, you’re essentially stumbling in the dark when it comes to optimizing conversion rates.
Remember, Google Analytics is only as functional as the ones using it.
Drill Down On Your Plan
Before you go off the deep end setting up a complicated reporting procedure, you’ll need to gain clarity around your strategy. A well-defined measurement plan helps you measure your online platform’s efficacy and performance over time.
Consider these key questions:
- What is my business’ ultimate goal?
- What action do I want site visitors to take when they land on my platform?
- What are the missions and values of my brand?
- What analytics data am I curious about? What do I most want to know about my customers on a broad level?
- For my platform, what is audience analytics used for?
- How can I gauge directly what metrics relate to my fundamental goals?
You may want to draw out a simple table or mind map outlining your goals. For instance, consider the example of a mid-sized e-commerce site.
An e-commerce platform will, first and foremost, want to generate sales and continued growth. Increased sales can be fostered through revenue generation and bolstering recurring customer purchases.
Sub-goals may include increasing the customer base associated with a specific region and increasing the revenue related to a particular product. Related goals will relate to building a recognizable brand, increasing customer loyalty, and encouraging a social community around the company.
The e-commerce platform will have to identify metrics that clearly relate to their primary goals. They will pay attention to measurements related to transactions, organic sessions, percentage of new versus returning visitors, and the site referral type.
Try to categorize metrics by what primary goal they’re directly associated with. For instance, a business stakeholder will want to know about revenue generation associated with a specific site referral link, while the site developer will want to analyze metrics around page response time.
Create a plan that separates reports based on how they relate to your fundamental goals. Once you’ve got a clear plan in order, it’s time to optimize your site for more effective report generation.
Understand Audience Overview
If you’ve just launched your first Property tag on Google Analytics, you may be frantically searching the web for “google analytics audience overview not working”.
Confused? Take a step back and breathe for a second. If you’re searching “google analytics audience overview not working”, keep in mind that standard reports may have a two to three-day data processing latency. Metrics like traffic, sessions, and bounce rate may not be accurate for several days (yet most measures catch up within ten to fifteen minutes).
The Audience Overview is the base-level, absolute view of your site’s performance over time. Site owners can look at data concerning their users, new users, session lengths, number of sessions per user, and page views. Take a look at this Audience Overview with a focus on the Bounce Rate:
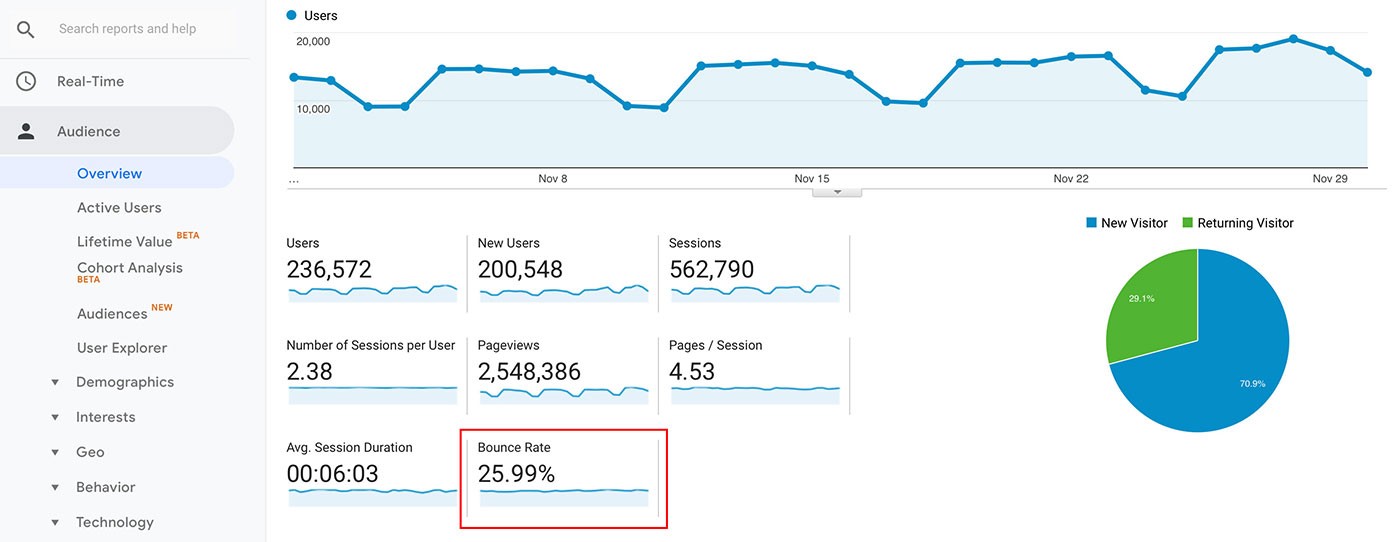
(Image Credit: Mangools)
The Bounce Rate should be of particular interest – this metric measures the number of visitors that land on your site but leave before interacting with it. If you have a one-page site, it’s perfectly normal to have a high bounce rate.
Your Audience Overview can help you better-gauge the metrics you’d like to fine-tune your Google Analytics reporting for. Always keep them in mind as you develop segments, filters, and event tags, which we’ll dive into below.
Track Interactions Through Event Marking
Google Analytics allows you to track specific events each time a user performs them. It should go without saying that this is tremendously helpful in terms of understanding your site’s audience.
You can set up an Event Tracking view with four distinct parameters: label, value, action, and category. For Example:
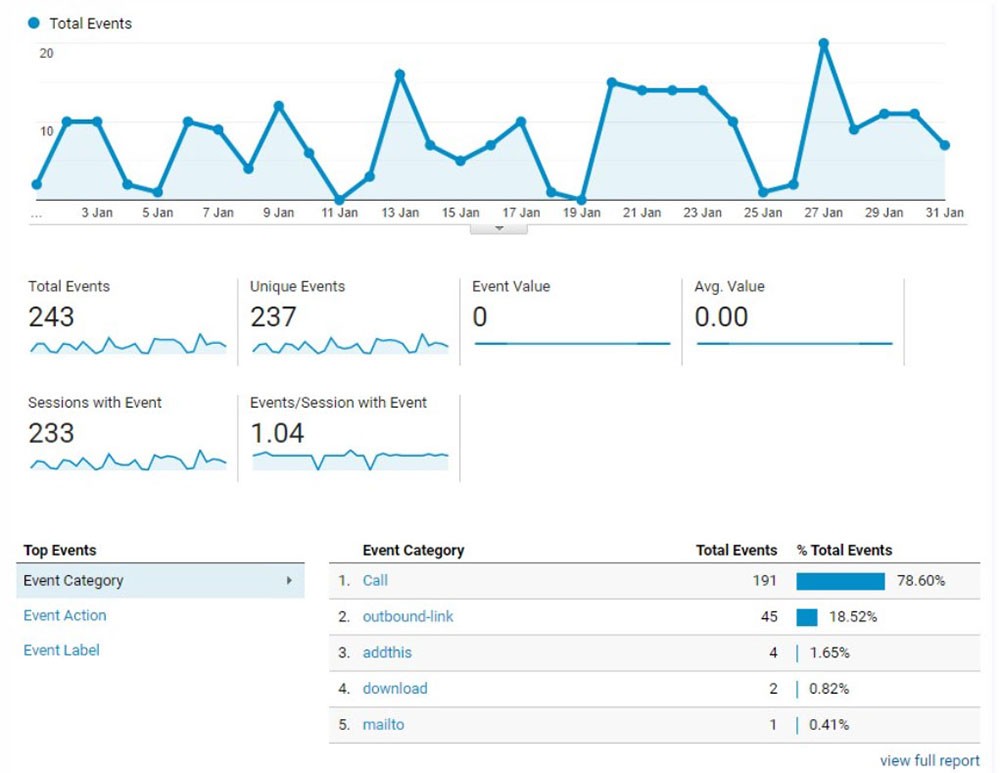
(Image Credit: Hallam Internet)
Setting up an event allows you to separate certain occurrences by pre-defined types. Without creating event tags, any behavior that a user performs (such as a click) is logged, yet can be difficult for site owners to understand.
Want to track how often a site visitor downloaded a specific file? You could create a new event tag that categorizes the click as a “file click” under the action “download” with the label “company brochure”.
Labels are used to categorize specific events while categories help siloe events into similar types. Optionally, value can be used as some measure associated with the event, such as “amount of seconds the user watched a video” or “time in seconds for the video player to load”.
Consider the types of events that are unique to your platform. For example, an e-commerce site would be interested in when products are added to or removed from the customer’s cart.
You can even tag certain events to remove them from overall Google Analytics event tracking. Since event tracking is technically considered a client request, many site owners manually tag event tracking itself so that it won’t impact bounce rate metrics.
We hope that you found this article useful.
If you want to know more interesting about your site health, get personal recommendations and alerts, scan your website by Diib. It only takes 60 seconds.
Filter Your Data
Through Google Analytics, you can filter your data to limit what is included in a report. One or more filters can be combined advantageously.
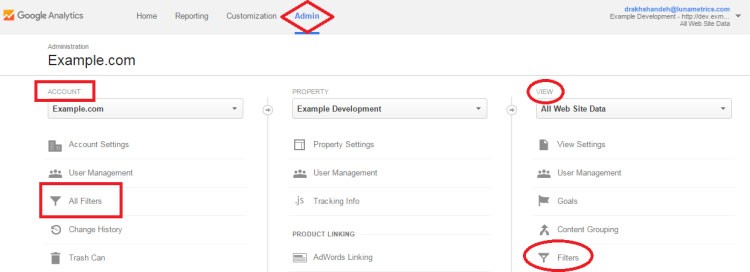
(Image Credit: Bounteous)
Currently, GA offers eight different methods of inclusion and exclusion-based filtration, including search-and-replace, advanced filtering, external-internal traffic, domain references, filter-on geography, custom fields, and social network filtering.
Unlike segmenting, view filters modify the data that’s available in a generated report. Small sites often exclude traffic generated from their own device or organization, which makes analyzing client data much cleaner in the future.
With a pre-defined filter, you can choose to include or exclude data based on ISP domain, sub-directories, IP addresses, and hostname.
We suggest you start by excluding internal traffic, standardizing the case on search terms, and adding your domain name to reports. This will help your data better reflect actual usage patterns and behavior.
Filtering is just one way that site owners understand audience destinations Google Analytics trends.
Segment Your Data
Segments refer to subsections of your analytics data that provide meaningful insights concerning your audience. You can create segments based on your client’s location or the type of actions the client performs.
Without a doubt, segmenting your data is one of the best ways to identify new trends and uncover patterns. While Google Analytics provides default segments, custom segments allow you to more powerfully understand your audience.
Many site owners create a segment that filters out data from spam URL websites, which helps them gauge more properly the actual size of their audience.
Experts recommend segmenting data based on conversions, bounced sessions, branded versus non-branded traffic, and traffic source. Audience destinations Google Analytics can be very useful.
Use Analytics Intelligence Properly
Google Analytics intelligence is one of the newest features of the GA platform. The machine learning tool helps site owners to better craft reports and tap into meaningful insights.
Inside your Property view, a search bar allows you to pose questions to the AI. The AI can answer a huge range of questions in simple language, providing a quick overview that links to a full report. This is what the search bar will look like:
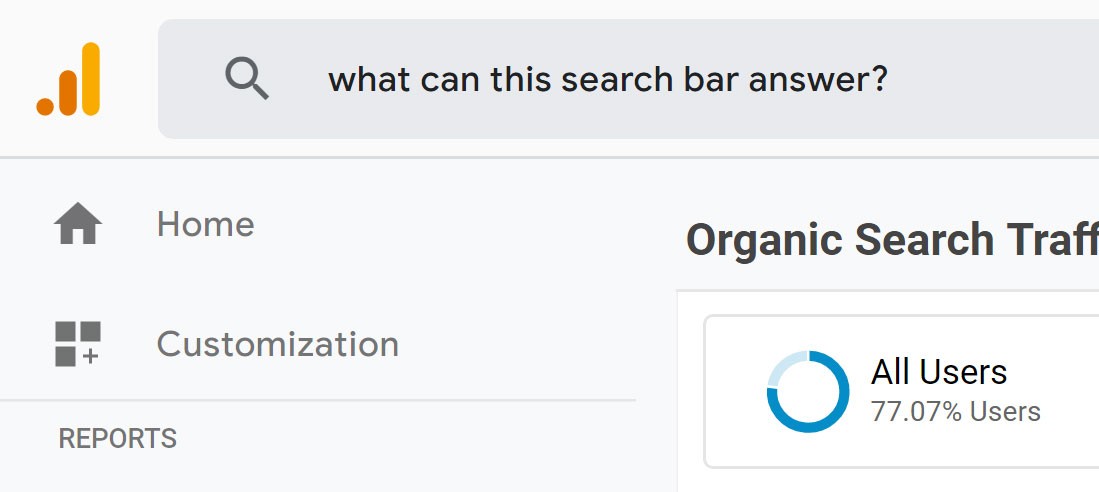
(Image Credit: CXL)
Try asking questions like:
- Why did my traffic drop last month?
- What referral source resulted in the best conversion rate in 2017?
- Graph session length of users in Chicago versus New York for last week
- What percentage of sessions are from women?
- Did any anomalies occur in traffic last week?
You can ask questions that require a comparison of data for different values, shares, percentages, or complex multi-part questions. This allows e-commerce site owners, advertisers, and publishers to get answers concerning the most needed knowledge.
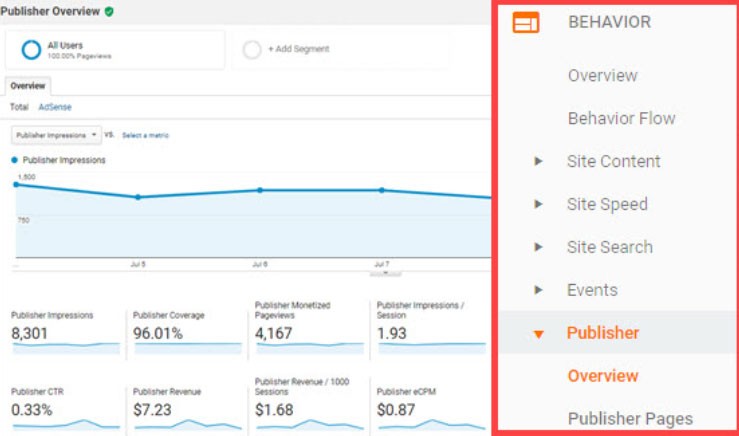
Google Analytics intelligence will also provide unprompted insights under the Insights tab. These reports are automatically generated to warn you about recent changes in user behavior, conversion rates, and session length. Here is what the insights could look like:
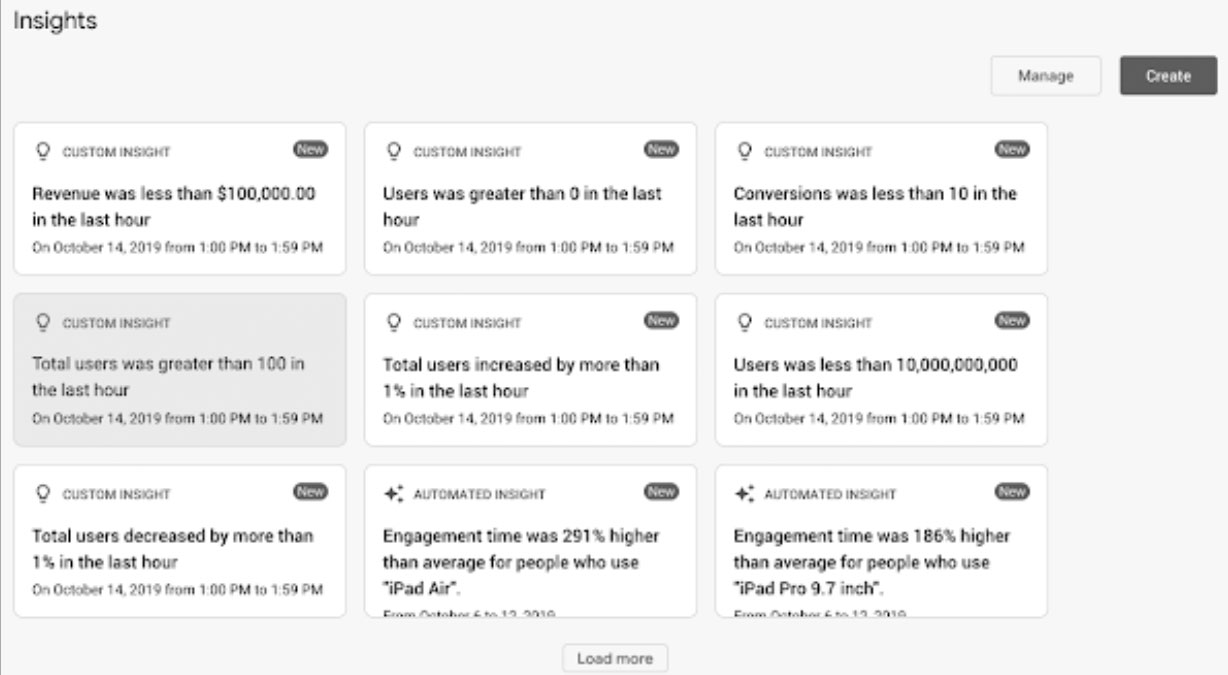
(Image credit: Google Support)
Share Your Insights
One reason that Google Analytics is so widely used is that collected data can be easily imported and exported. Curious about the Google Analytics export audience? Want to know how to import an audience from analytics to adwords? Listen up.
Google Analytics export audience allows you to create a report that can be shared with others. The reports can be specified over data range and other useful metrics for company stakeholders or your own recordkeeping purposes.
To properly export, open up the report of interest. Keep in mind that all data, regardless of filter options, is displayed on screen – you’ll want to double-check that you’ve set the proper data range and report settings.
Across from the report title, click Export. You can select Google Analytics audiences output formats like TSV, CSV, Excel sheets, Google Sheets, and PDF.
It’s also possible to share reports with up to 400 email addresses. Reports can be automatically generated and sent-off based on predetermined time periods.
We also suggest that you import audiences from analytics to adwords. This allows you to access your Google Analytics conversions and data associated with ad clicks. Site bidding AI can be used to optimize bids that directly increase conversions while mitigating costs.
Creating exports and imports is an important (and useful) feature of the Google Analytics platform. While exports make it easy to share insights across a team of developers, imports allow you to better track conversions and lead generation.
Diib®: Get to Know Your Google Analytics Audience!
Google Analytics is a powerful tool for both business leaders and site owners. Make sure to use it wisely by generating meaningful reports, segmenting your data, creating filters, and leaning on Google AI. Diib Digital provides actionable insights into all the metrics we’ve talked about. Some of the features we know you’ll love about our user dashboard include:
- Bounce rate monitoring and repair
- Social media integration and performance
- Broken pages where you have backlinks (404 checker)
- Keyword, backlink, and indexing monitoring and tracking tools
- User experience and mobile speed optimization
- Technical SEO monitoring
Click here for your free scan or simply call 800-303-3510 to speak to one of our growth experts.
FAQ’s
It can be difficult to customize your content based on your users and their behavior. Here are some of the steps to optimize your content: 1) Set up a date range and advanced segment. 2) Create attainable goals. 3) Use Drilldown Report to analyze performance and get new ideas for content. 4) Create a custom dimension in the case of many blog authors. 5) Use Site Search Report for content ideation and creation.
The “audience” tab lets you search your customers, getting familiar with demographics like: location, retention and device technology. “Acquisition” will give you an idea of how customers find your site. “Behavior” explains how customers act once they get to your site.
With the use of a unique tracking code, Google Analytics tracks all data on every page of your website.
GA provides many insights into your website. With this info, you can easily target those who are likely to convert. You can adjust your campaign according to this information.
This is calculated by subtracting the initial value of the investment from the final value of the investment. Then divide the new number by the cost of investment.


socialvinod says:
Best Social Media Marketing
Herbalhills Wellness says:
Great Blog!! That was amazing.
Your thought processing is wonderful. The way you tell the thing is awesome.
If anyone in our audience needs Ayurvedic Product Manufacturers then please click here: https://www.herbalhillswellness.com/
OPTIMIND - TINA says:
Nice article. its very informative and knowledgeable. Thanks for sharing this post
husain sabir says:
When it comes to managing finances, Chartered Accountants (CAs) play a pivotal role. In the bustling city of Nagpur, these financial wizards are indispensable for businesses and individuals alike. From tax planning to auditing, CAs offer a wide array of services that are crucial for financial well-being.
First and foremost, it’s essential to understand the significance of hiring a CA in Nagpur. The financial landscape is complex, and navigating through it without professional
husain sabir says:
excellent blog very informative good