 17 min read


Infographics have gained a lot of popularity lately as an effective way for businesses and organizations to communicate important messages with the people they serve. The expression “a picture is worth a thousand words” is very true in this case. Infographics are becoming an essential part of marketing materials.
What is an Infographic?
The basic definition of an infographic is a visual representation of information. It is characterized by using eye-catching imagery, striking visuals, and very minimal text. The purpose of infographics is for people to quickly and completely understand a message.
The best infographics are those that are unique, memorable, and catch people’s attention. They are designed to educate people and help them remember important content. Thus, the more interesting they are, the more people will remember the message, and the more they will understand it.
Why Do Small Businesses Use Infographics?
Small businesses want an easy and effective way to communicate information in a concise manner. Sometimes there’s complex information that needs to be broken down into small clear messages that people can easily capture. By adding a visual component to what you’re communicating, the reader is able to understand the message more efficiently by creating a visual imprint in their brain that they will be able to easily recall.
Infographics help small businesses in the following ways:
- Gives readers a quick snapshot of the topic.
- Turns a complex message into a simple one.
- Makes statistics, research results, and survey data more digestible.
- Creates a summary of a long piece of information.
- Provides comparisons and contrast amongst various options.
- Creates awareness about a particular topic.
- Helps people quickly explain a topic when it is difficult to do with words alone.
- Makes business websites more credible and helps gain new traffic by improving SEO rankings.
As you can see, infographics are appropriate in any field or industry. Any business, even if very small will look more professional with the use of infographics.
Studies conducted about infographics have provided the following results:
- About 90% of data that connects with the brain comes from visual stimulation (Source).
- On average, people read only about 20-28% of the words they see (Source).
- Infographics are read approximately 30 times more than text articles (Source).
- Web traffic can improve by 12% with the use of infographics (Source).
- Compared to other content, infographics are shared three times more (Source).
- Reports have confirmed that humans process visual content 60,000 faster, which is why we process visuals much better than we do text (Source).
Since infographics work across various platforms, it makes sense for small businesses to use them to create brand recognition, attract more traffic to their website, reach a new audience, and enhance their overall marketing approach.
Improve your content marketing + SEO in 60 seconds!
Diib uses the power of big data to help you quickly and easily increase your traffic and rankings. We’ll even let you know if you already deserve to rank higher for certain keywords.
- Easy-to-use automated SEO tool
- Get new content ideas and review existing content
- Checks for content localization
- SEO optimized content
- Built-in benchmarking and competitor analysis
- Over 500,000k global members
Used by over 500k companies and organizations:
Syncs with 

How To Choose Infographics
The following tips will help you choose effective infographics:
- Keep It Simple: You want to be very concise, the idea is to summarize a complex message into a very easy to understand the sign. It must be easy to interpret, which means less is better. Use only three to four colors and leave some space so that it is easy on the eyes.
- Make It Universal: Everyone should be able to understand the message. Consider using icons that are widely recognized. There are symbols that are used worldwide to convey meaning. Stick to what is familiar to most people and you’ll certainly reach a large amount of the population you desire.
- Be Unique: Although it may be a message people have heard before, being unique allows your brand to build continuation. Be creative with colors, fonts, images, phrases, and proportions. Choose infographic types that are not commonly used or create a novel one new to audiences.
Most Popular Types of Infographics For Small Businesses
When it comes to using infographics for small to medium-size businesses, they are an easy to read and fun way to convey messages. They are essential to building brand awareness, bringing more traffic to your website, boosting search engine optimization, and creating viral marketing campaigns.
We’ll now review some of the most popular types of infographics that have proven effective for small businesses.
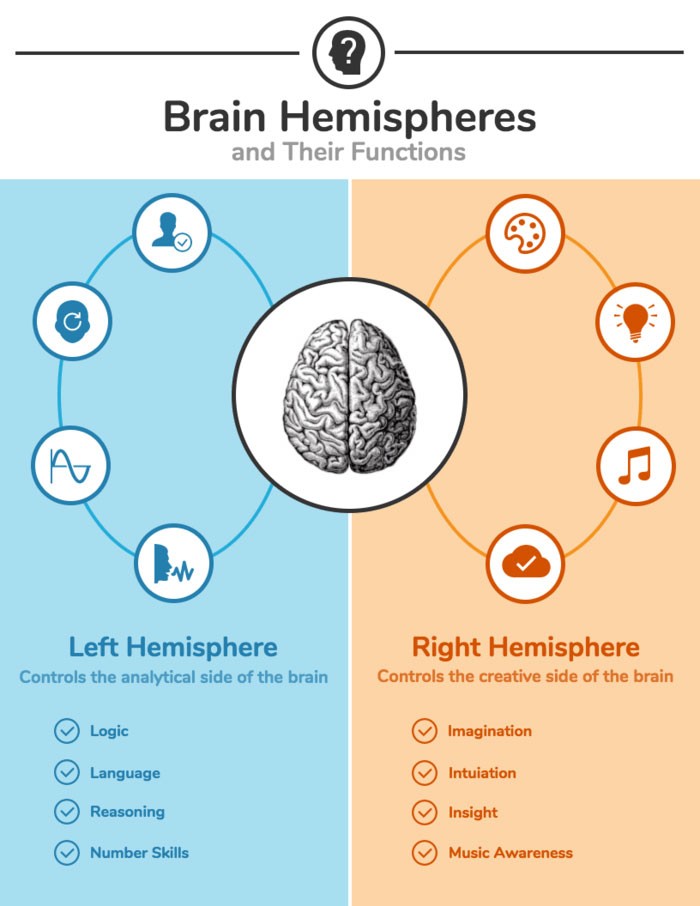
1. COMPARISON INFOGRAPHIC
When advertising a product or service, the customer will naturally think about comparing other options available on the market. A great way to help them make that comparison in an unbiased way is through a graphic that has two sides, either side by side (vertical), or top or bottom (horizontal). For example:
(Image Credit: Venngage)
A great way to set this one up is comparing item A vs. B with a vertical split and columns that compare different features. Contrasting colors can be used to differentiate the products. Using a brighter color for the option you want the readers to pick is an effective way to promote your item.
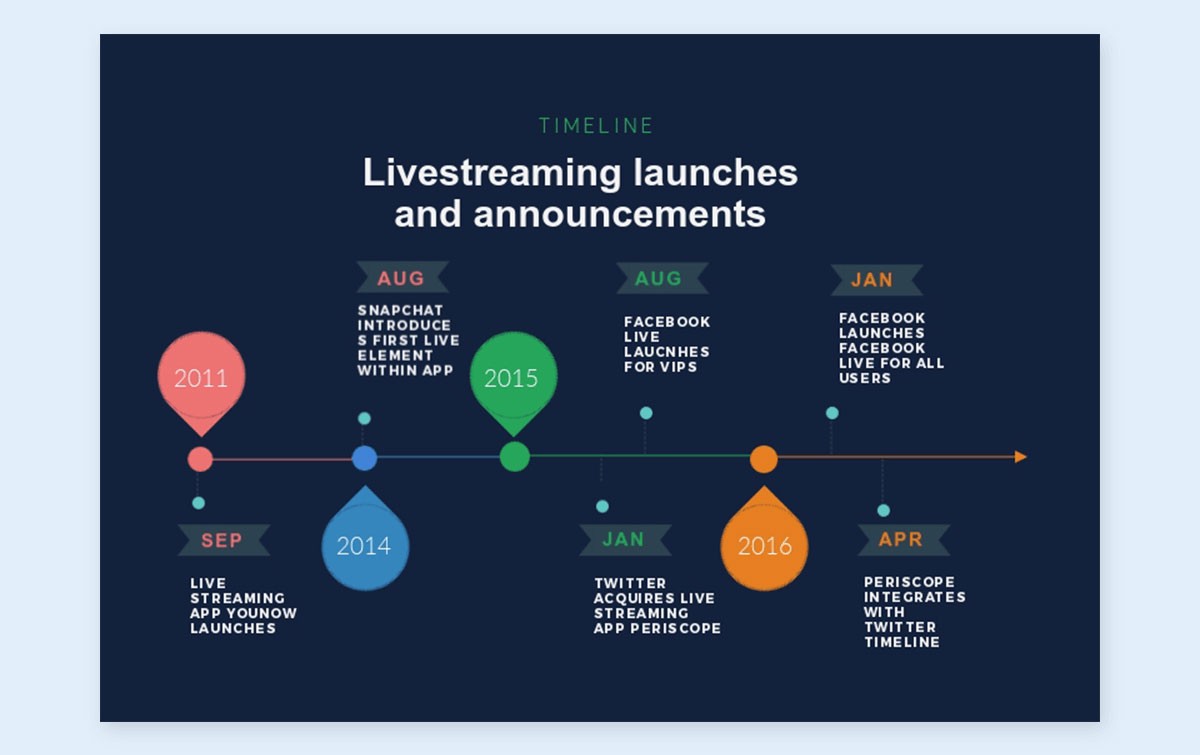
2. TIMELINE INFOGRAPHIC
Using a timeline allows the readers to visualize important dates, learn the history of something, or get a snapshot about events.
You Might Also Like
It is a great way to get a timeline about a topic, our human brain has a spatial conception of time. Points in time can be highlighted with icons, photos, lines, and labels. To show time progression a color gradient is a great way to help someone understand the information. For instance:
(Image Credit: Visme)
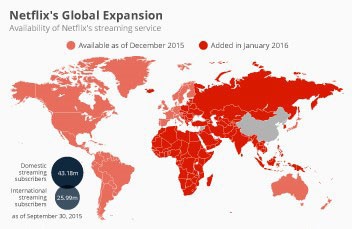
3. GEOGRAPHIC INFOGRAPHIC
To explain location-specific data, demographics, or a large quantity of information, using a geographic image is effective. The visual focus is usually a map chart. They are usually used to compare data according to region and populations. For example:
(Image Credit: Statista)
Label each point on the map with text to create a clear understanding of the meaning of what the map is about. Use different colors to convey different meanings. A map series can be used to show changes across time.
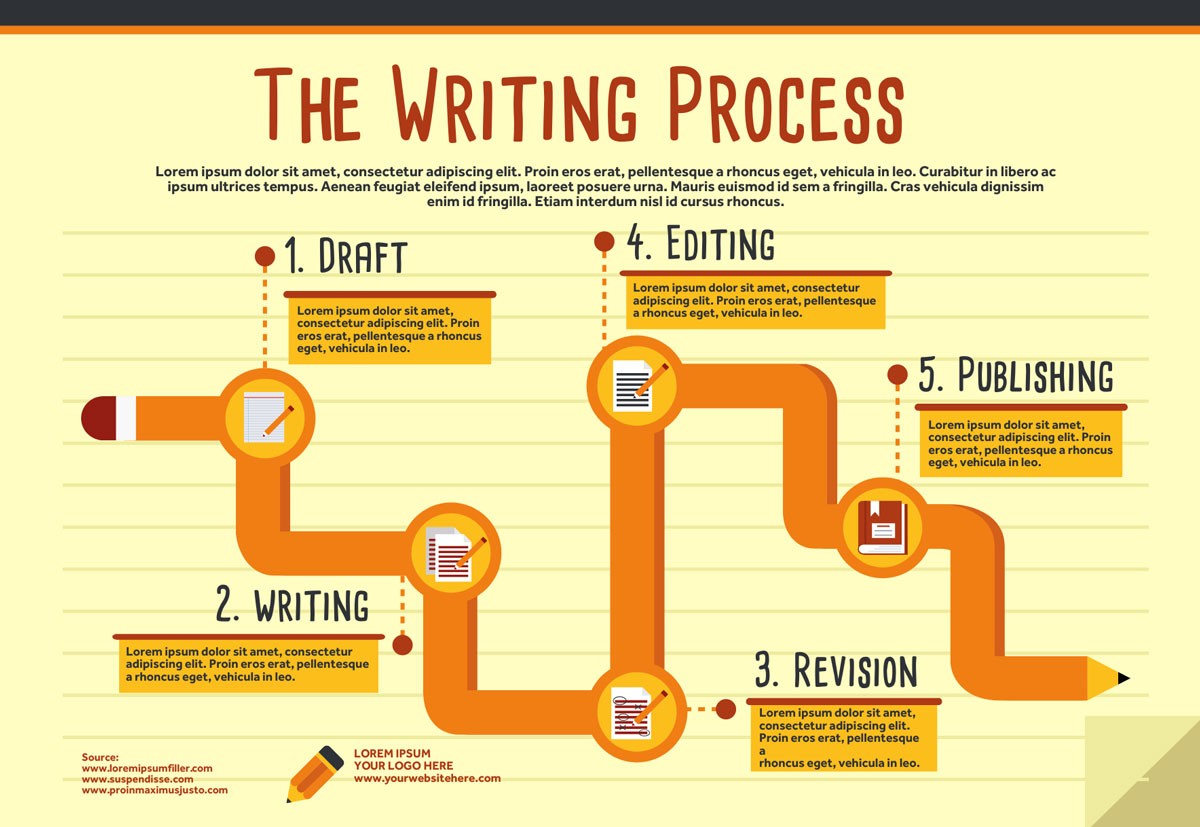
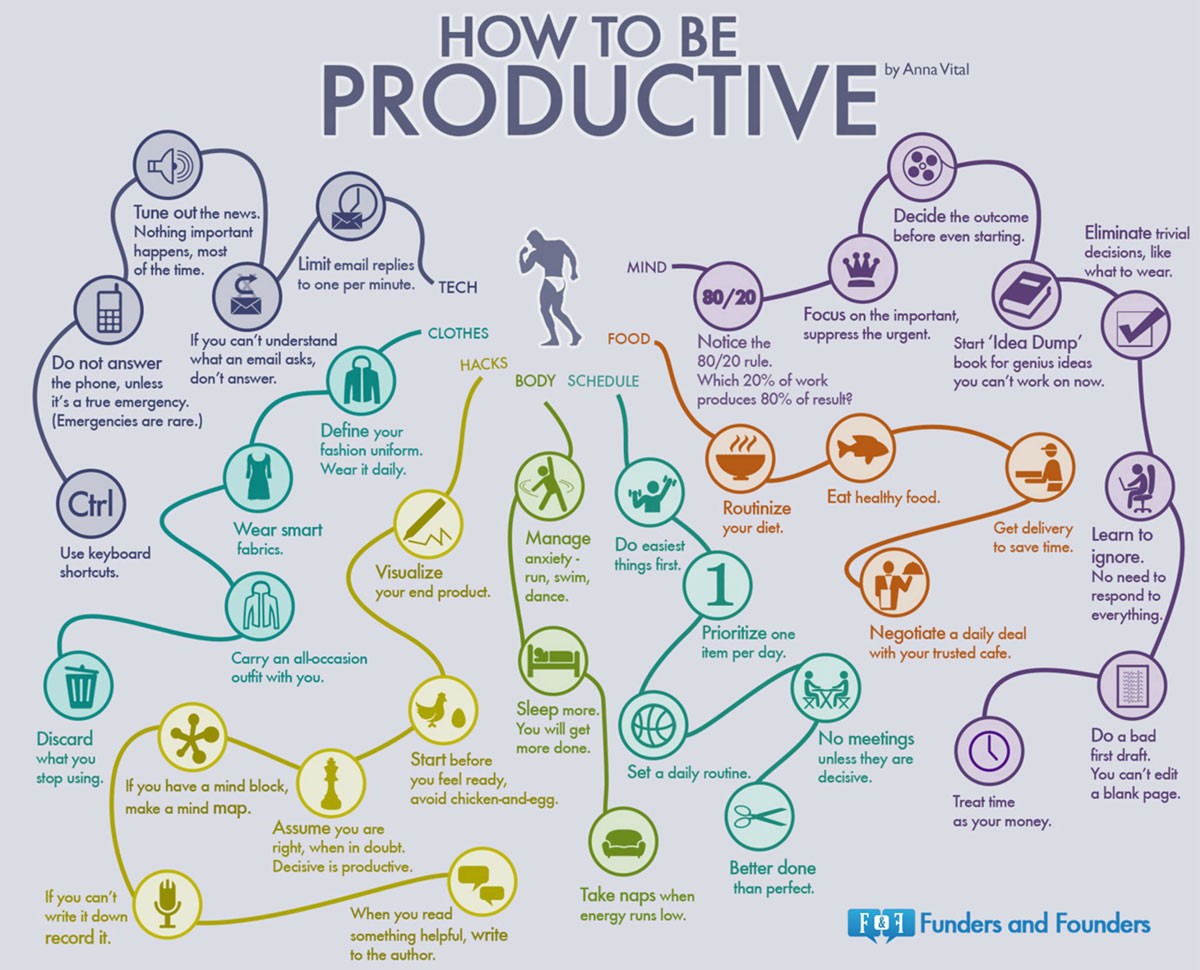
4. PROCESS INFOGRAPHIC
This type of infographic is used to show a condensed format of steps that accomplish a process. Process infographics are usually set up using a left-to-right or top-to-bottom order. By numbering the steps, the process will be clear.
Different colors on numbered headers can be used to highlight each step. An image can accompany each step to reinforce the meaning of each section. Another helpful insertion is using directional cues such as lines, shapes, or arrows that draw the eyes in a particular direction.
To save space, a “snake” layout can be used which takes each step across the graphic in an S-shape. For example:
(Image Credit: Easel.ly)
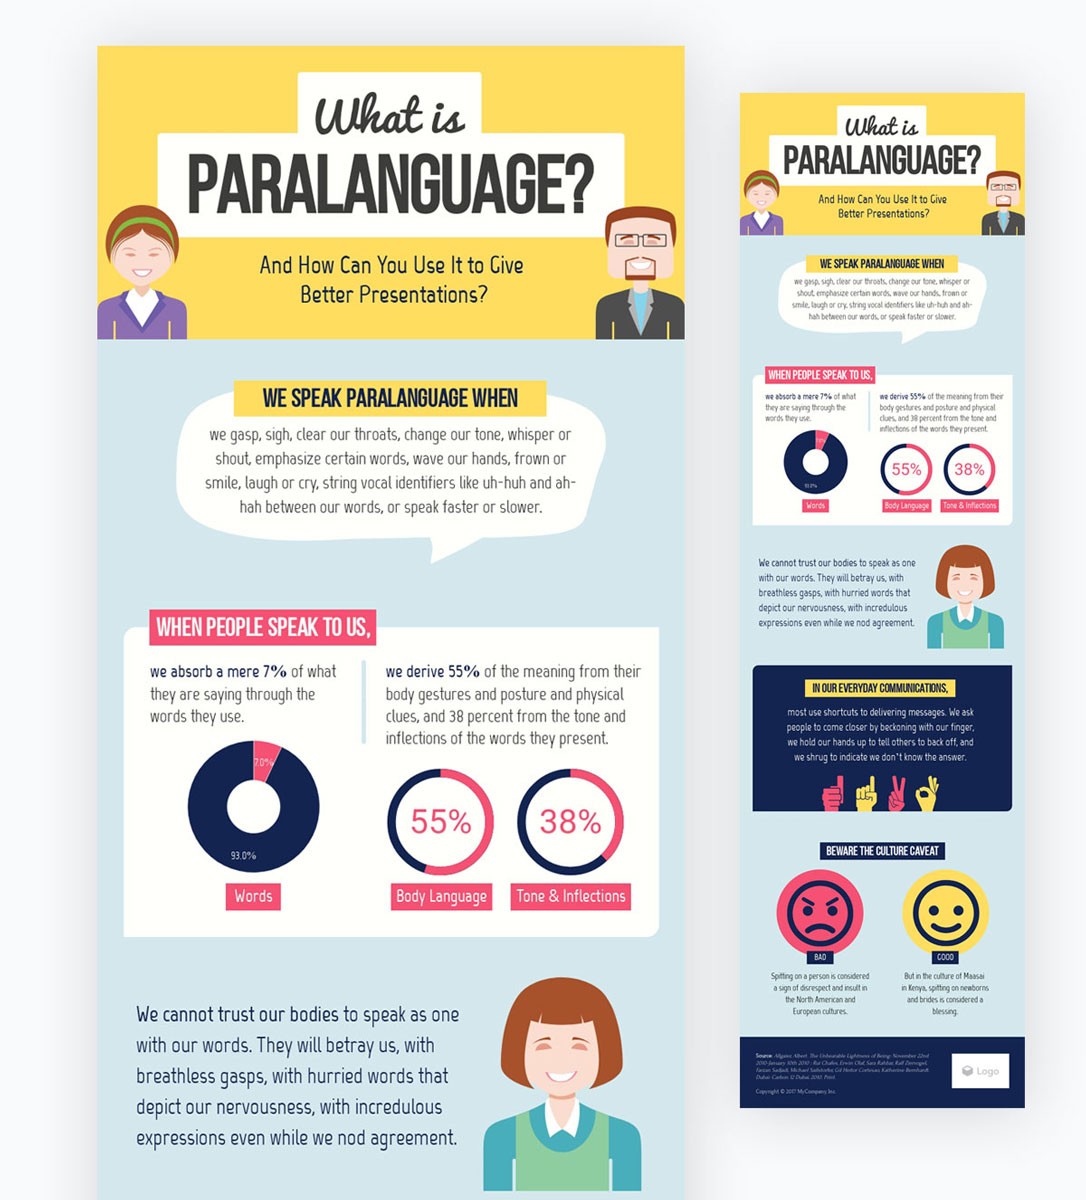
5. STATISTICAL INFOGRAPHIC
To help people visualize data from various sources, survey results, or supporting evidence for arguments, statistical infographics easily accomplish it.
The data will be the focal point while the visuals and layout will help elaborate the story. The storytelling components may be icons, images, distinct fonts, or charts.
If there are multiple statistics, a great layout is using bubbles or clouds to help each piece of information stand out. To help the most important information stand out, you can put it in a large bubble and decrease the bubble size as you progress. Here is an example of a statistical infographic:
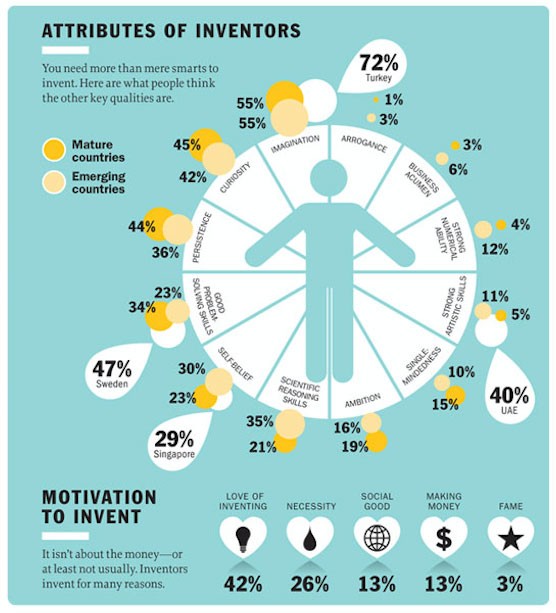
(Image Credit: Killer Visual Strategies)
6. HIERARCHICAL INFOGRAPHIC
This type of infographic sorts the information from greatest to least. A very famous example is Maslow’s Hierarchy of Needs pyramid. It starts with the most important human needs at the largest level at the bottom of the pyramid and it climbs up with smaller sections until reaching the smallest section at the top with the least important human need. For instance:
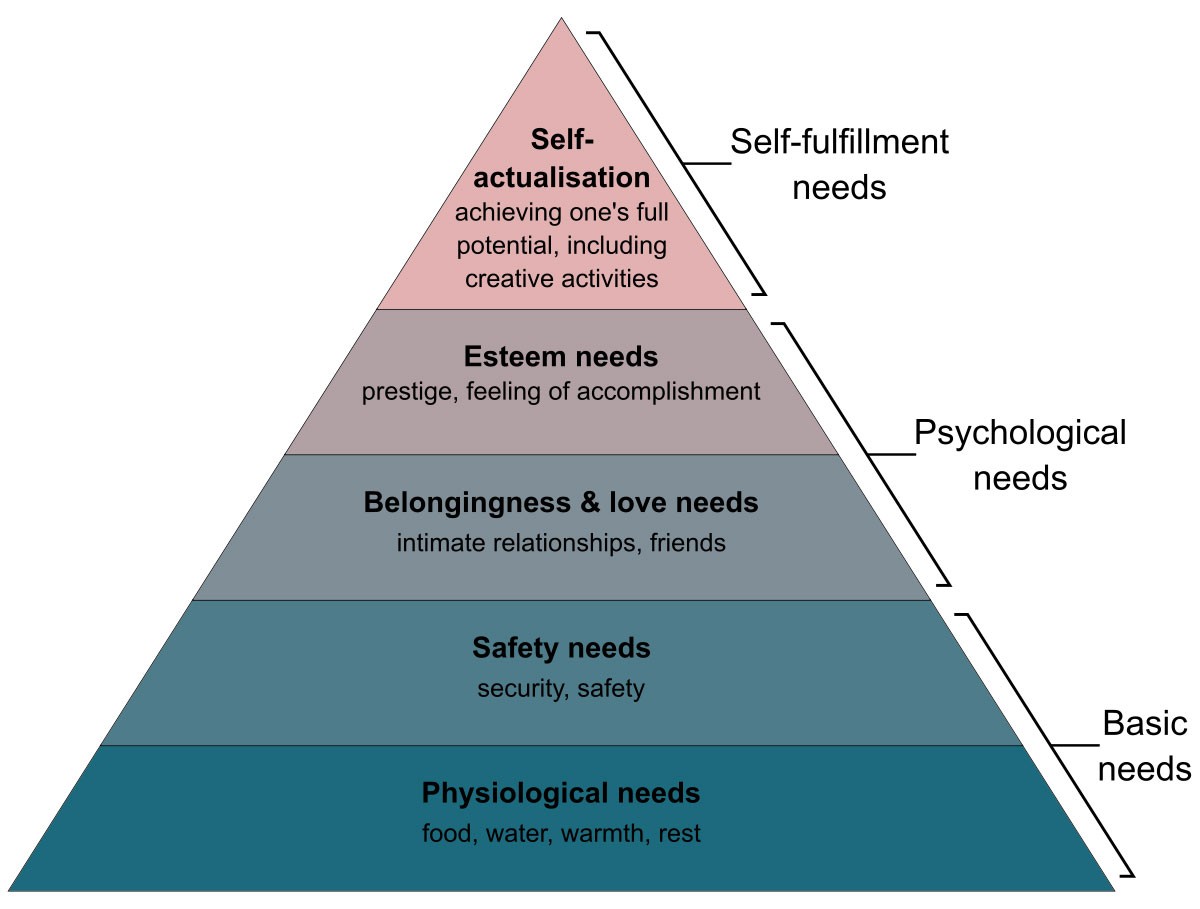
Hierarchical infographics are perfect to visualize a chain of command or an organizational flow chart.
7. LIST INFOGRAPHICS
To convey a list of tips, a collection of resources, an array of examples, or other types of lists, using this type of infographic organizes information very well.
Lists are generally very straightforward, thus the goal here is to create an eye-catching design that turns an ordinary list into something much more interesting. Instead of using bullet points icons are much more fun. Creative color schemes and fonts will make the information stand out much more.
Using numbers on the list is another way to help it flow better. Each number can be encased in a colored circle to make it much more visually pleasing. For example:
(Image Credit: FIPP)
8. CHART INFOGRAPHIC
A chart can be created for just about any topic, the formatting depends on the goal of the chart. It must be created to inform the readers about one data point or topic that doesn’t need a lot of contexts to communicate. The chart can compare differences or similarities of values, as well as show changes such as trends over time.
To effectively demonstrate a chart the data can be organized in ranks, patterns, orders, or groups. Showing relationships or correlations among values or variables is another compelling way of getting the message across. The image below shows a chart infographic:
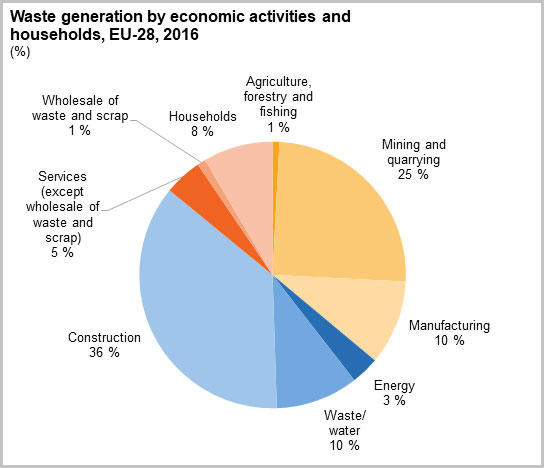
(Image Credit: Europa EU)
9. INFORMATIONAL INFOGRAPHIC
One of the best ways to convey a specialized or novel concept is with a template that clearly communicates an overview of the subject. This is achieved by using the forthright informational infographic.
Generally, this type of infographic is split into distinct sections with headers that highlight a description of each segment. Using a numbering system will create a good flow, people like to see a numbered list because it gives them something concise to recall.
Keep the information succinct, such as using five points to highlight the message, but they don’t have to be in chronological order, a circular layout is a great way to highlight each point without a particular structure.
To make the infographic stand out, use different colors, and flow directions to keep people interested in the information. For example, you can use different background colors to complement each section. For example:
(Image Credit: Visme)
Another way to make an eye-catching informational infographic is to include decorative borders to make each section stand out and add some extra flair to a simple format. Keep it functional but artistic.
10. HOW-TO GUIDE INFOGRAPHIC
Creating an educational and helpful infographic is a great way to promote a product or service. By providing a quick guide on how to achieve something, readers will be interested in more of the materials you create.
As you educate your audience, you have the opportunity to create a piece of material that helps you gain authority on the subject matter. For example, if you’re a small business that teaches people how to train their dog, you can have a how-to guide infographic that shows how to potty train their new puppy.
Clearly give the infographic the title of a “how-to” guide. Use a format that shows instructions step-by-step. Keep the description of each step simple, the infographic is not meant to develop the topic, instead, it is a preview of what it takes to achieve that task. Here is an example:
(Image Credit: vWriter)
Using fun images and icons is a great way to instruct people. Not everything has to be detailed in words. There are some how-to guides that mostly use graphics as an instructional piece.
11. PHOTO INFOGRAPHIC
Incorporating pictures into an infographic can be a great way to present something unique. Sometimes it takes a real photograph to transmit the exact feeling you’re looking to communicate. There are various ways to incorporate photos, they may be combined with icons, or they may be used as a before and after shot with notes to accompany the images.
Photographs can also be turned into artistic images by using different color gradients and filters. They give a sense of the real-world story and are a way to make the infographic stand out.
(Image Credit: Venngage)
12. ANATOMICAL INFOGRAPHICS
Anatomical infographics let you show parts of any object, not just the human body. It can be utilized for a description of a vehicle and its different parts, a building with all its engineering components, and of course an animal or human body.
This type of graphic serves the purpose of providing an easy explanation of how something works and all its components. It also allows one to see the correlation between different parts and where in the structure they are located. They are both educational and fun to view. For instance:

(Image Credit: Dreamstime)
Growing Your Business With Infographics
Your online presence has an unparalleled power to provide your business credibility. One helpful and enticing infographic can draw a vast number of unique traffic to your website.
When it comes to SEO rankings, infographics remain an effective tool to generate a high amount of backlinks versus other link building techniques. They have become even better as the years go by because the graphic design has become more sophisticated.
Besides being an effective marketing tool and helping your small business spread brand awareness, infographics are also a way to target your niche and allow them to link or share it with a similar population. If one of your infographics goes viral, you’ll be exposed to a high number of people that qualify as being part of your target audience.
If you create a well-formulated infographic it can be used in many other places creating inbound marketing traffic for your business. Even if your business is very small, utilizing infographics will allow you to climb to a higher level in your industry.
We hope that you found this article useful.
If you want to know more interesting about your site health, get personal recommendations and alerts, scan your website by Diib. It only takes 60 seconds.
Quality vs. Quantity
Be very selective with the infographics you create. It is better to have one amazing infographic than several mediocre ones. Always research your content extensively to ensure accuracy. Your business will be perceived as a reliable source of information and you’ll have strong credibility.
Producing quality content is one definite way to increase traffic to your site and gain more followers, likes, views, subscribers, and eventually new clients.
Final Thoughts
To get the online presence of your business up-to-speed or to step up your marketing to the next level, it is never too late to start using infographics.
We have covered the major types of infographics circulating the market, but why not get creative and come up with new categories of your own. The sky’s the limit when it comes to the artistic, educational, and marketable variations you can create.
Your SEO rankings are very important especially when it comes to drawing new traffic to your website. Focusing on providing quality infographics will give your business the rankings it needs to continue to gain more clientele.
Diib®: Custom Infographic Statistics On Demand!
Making infographics part of your marketing strategy is a fun and effective way to convey the messages you want to share. The world of digital marketing is evolving and we’ll continue to see new trends in visual materials. Partnering with Diib Digital can provide you with the metrics necessary to make strategic business decisions and will help you to know which of your infographics are effective and which aren’t.
Here are just a few of the features of our User Dashboard our clients report loving:
- Keyword, backlink, and indexing monitoring and tracking tools
- Google Core Algorithm monitoring
- Infographic monitoring
- Alerts to broken pages where you have backlinks (404 checker)
- Alerts and Objectives that guide you to strengthen your website
- Monthly call with a growth expert
Click here for your free 60 second site analysis and industry ranking or call 800-303-3510 to speak with one of our Growth Experts.


