 11 min read


If you think building a website alone is enough for getting maximum exposure and traction for your business, you are wrong. Website reporting is one of the elemental and crucial factors in moving forward, and you need to understand the art of analysis and stats to stay strong in the hostile work climate.
What Is Website Analytics and Reporting?
Now that you have built a powerful website, it is time to take it to the next level and enjoy a high-performance level. However, you cannot simply achieve a high level of performance without website reporting or proper analytics. Therefore, you need to understand the different reporting metrics associated with your website and see how you can use current statistics to your advantage.
You have to constantly monitor your website and measure visitors’ data to optimize and fine-tune the website to offer an enhanced user journey and experience. You can use website analytics and different reporting metrics to optimize the website further. When you understand how to track user and visitor behavior, you will be able to achieve a better insight into how users currently engage with your website and how they want to interact with your website.
This way, you will be able to understand the current user journey on your website, and you will also be able to determine the desired user journey that visitors expect from your website. Web analytics help you measure traffic and monitor effective metrics to help market research into your potential audiences.
What a Website Analytics Report Contains
So, now that you understand why a website analytics report is important to enhance your website experience, you need to understand the perfect web analytics report template and its best results. Here are some of the important elements you should include in your web analytics report template and use them to your advantage.
Browser Report
The first thing you need to know is whether your website is compatible with the hundreds of different browsers available in the market. There is no point in creating a website that is only compatible with a single browser and doesn’t offer the same compatibility and responsiveness for other browsers. Therefore, you need to complete a browser report and include it in your web analytics report template.
One of the best ways to accomplish your browser report is to include conversions per browser and device. This means that you should create a report that shows conversions for different browsers, and it should also show conversions for devices, such as mobile phones, tablets, and PCs.
This way, you can further segment the browser report according to devices and platforms. You will be able to understand better how your website performs on different browsers on different devices. If you do not run an e-commerce website and cannot use conversions for each browser, you can swap this conversion with a goal value-related metric.
This means that whatever you are trying to accomplish, you should see whether your users are doing the desired action for your website. Here is an example of a Browser Report:
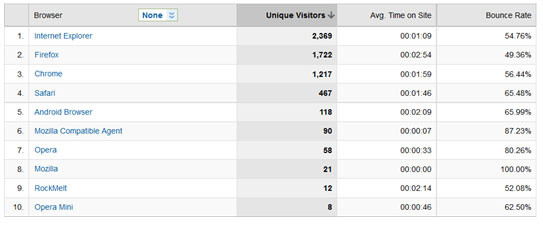
(Image Credit: Moz)
Mobile Compatibility Report
Modern-era users spend more than 70 to 80 % of the time on their mobile phones, and this is why you need to make sure that your website is compatible with mobile platforms. Therefore, you will need to include mobile compatibility and mobile performance report in your website report template. This will enable you to understand if your website is optimized for mobile devices or not.
Moreover, this report will also let you know if you need to make any changes to make your website more optimized for mobile devices and platforms. This way, you will be able to enhance the customer journey on desktops and mobile platforms alike.
Other than that, there are different mobile platforms, such as iOS platforms and Android operating systems. This is why you can further segment your mobile performance report according to the underlying operating system and see if your website is optimized for all the current and major mobile platforms or not. For example:
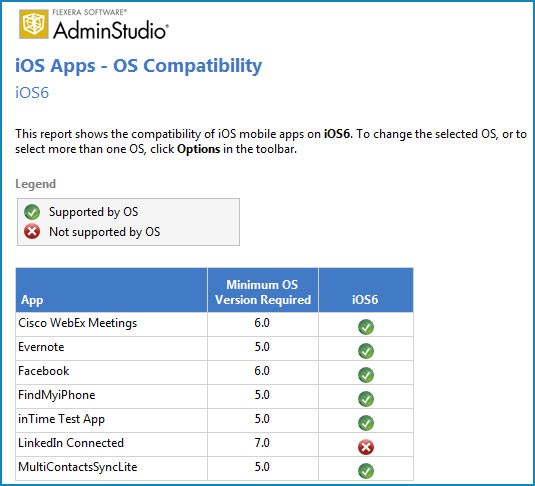
(Image Credit: Flexera)
You Might Also Like
Website Traffic Report
This is another important element to include in your website report template, and you will need to observe the different hours of the week that result in the highest traffic for your website. This report will help you understand what time of the day and what day of the week your website receives the highest traffic, and you can use this to leverage a better customer journey for your website.
Your traffic report should also include your website traffic origin, such as how did the users find your website. If you have ever used Google to search for anything and clicked on the top websites, you must have noticed a few specific keywords and numbers in the link. These numbers are used to keep track of your website traffic source, and these can help you understand how the users are getting to your website. For instance:
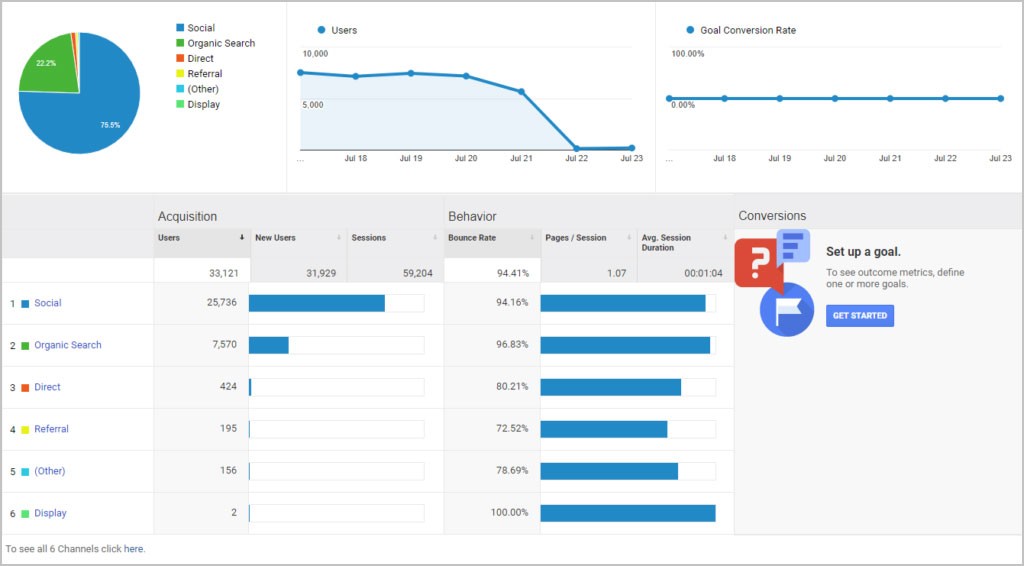
Visitors can use many different sources, such as search engine results, advertisements, or referral links, to find your website, and these can help you understand how to optimize your advertisements and marketing strategies according to the highest-ranking sources for your website.
Test your SEO in 60 seconds!
Diib is one of the best SEO tools in the world. Diib uses the power of big data to help you quickly and easily increase your traffic and rankings. Diib will even let you know if you already deserve to rank higher for certain keywords. As seen in Entrepreneur!
- Easy-to-use automated SEO tool
- Keyword and backlink monitoring + ideas
- Speed, security, + Core Vitals tracking
- Intelligently suggests ideas to improve SEO
- Over 500,000 global members
- Built-in benchmarking and competitor analysis
Used by over 500k companies and organizations:
Syncs with 

Page Views Report
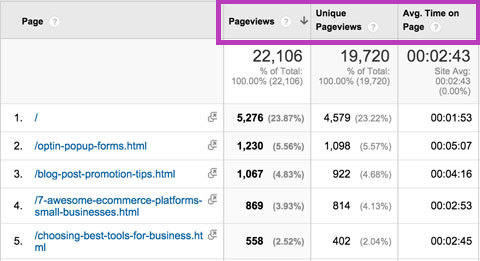
If you want to know how many times visitors have viewed the different pages on your website, this report will be extremely helpful as it can help you understand the number of unique visitors on every page of your website. This is how you can understand what pages bring in the highest number of conversions and what elements of your website are lacking.
This is among the core elements of a perfect website report example. It allows you to quickly optimize the low-ranking pages and turn them into high-ranking pages with a page views report. Moreover, your page views report will also include the number of pages that unique individuals visit on your website before leaving the website. This will allow you to understand the average user journey on your website, and you will be able to use this to create a better user experience.
Another important element of a page views report should be the average time on different pages. The average time on different pages will allow you to understand how much time an average unique individual spends on your website’s different pages and what pages bring in the highest average time. For example:
Google ranks different websites according to the average time spent on the different pages of that website. If the users only spend a few seconds on the website page and quickly leave, Google will rank your website lower than your competitors.
This is why you need to understand the average time for every page on your website, and you need to find a way to increase the average time for unique visitors. You can increase this time with the help of engaging content and other proven strategies.
Exit Percentage Report
Even if a unique individual spends hours on your website and browses through hundreds of different pages, you need to make a report of the last page visited by the different users. This is known as the exit percentage report, and it is an important element of any powerful website report example. For example:
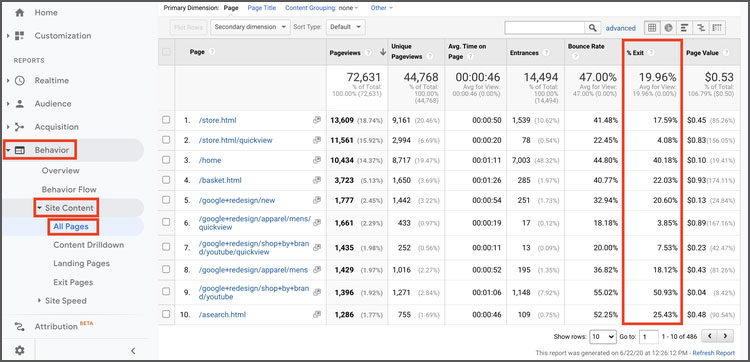
(Image Credit: Hotjar)
This way, you will understand how the majority of users interact with your website and what page is the most commonly used exit point from your website. It will help you optimize that page and get you more conversions than before with the right CTA and ad placement.
Geographical Data Report
Demographics report is one of the most important reports in any website report template. If you want international visitors, you will have to consider the different locations currently using your website.
For example, suppose you are currently in the United States of America and get a high percentage of users from France or Australia. In that case, you will need to update your website according to your clients and offer different language preferences to accommodate different locations.
You can also use the demographics data to further optimize your website according to the location that visits your website the most. This will help you retain customer loyalty and convert them into long-lasting viewers and customers. When customers feel that you are taking extra care to cater to their respective locations by offering them the choice of different languages, they will be more loyal to your website.
Moreover, you can also utilize the geographical data to optimize your website and generate more revenue. For instance, if your website’s highest number of visitors is from Australia, you can offer localized advertisements and use the geographical data to maximize your revenue and on-page SEO. The image below shows an example of a Geographical Data Report:
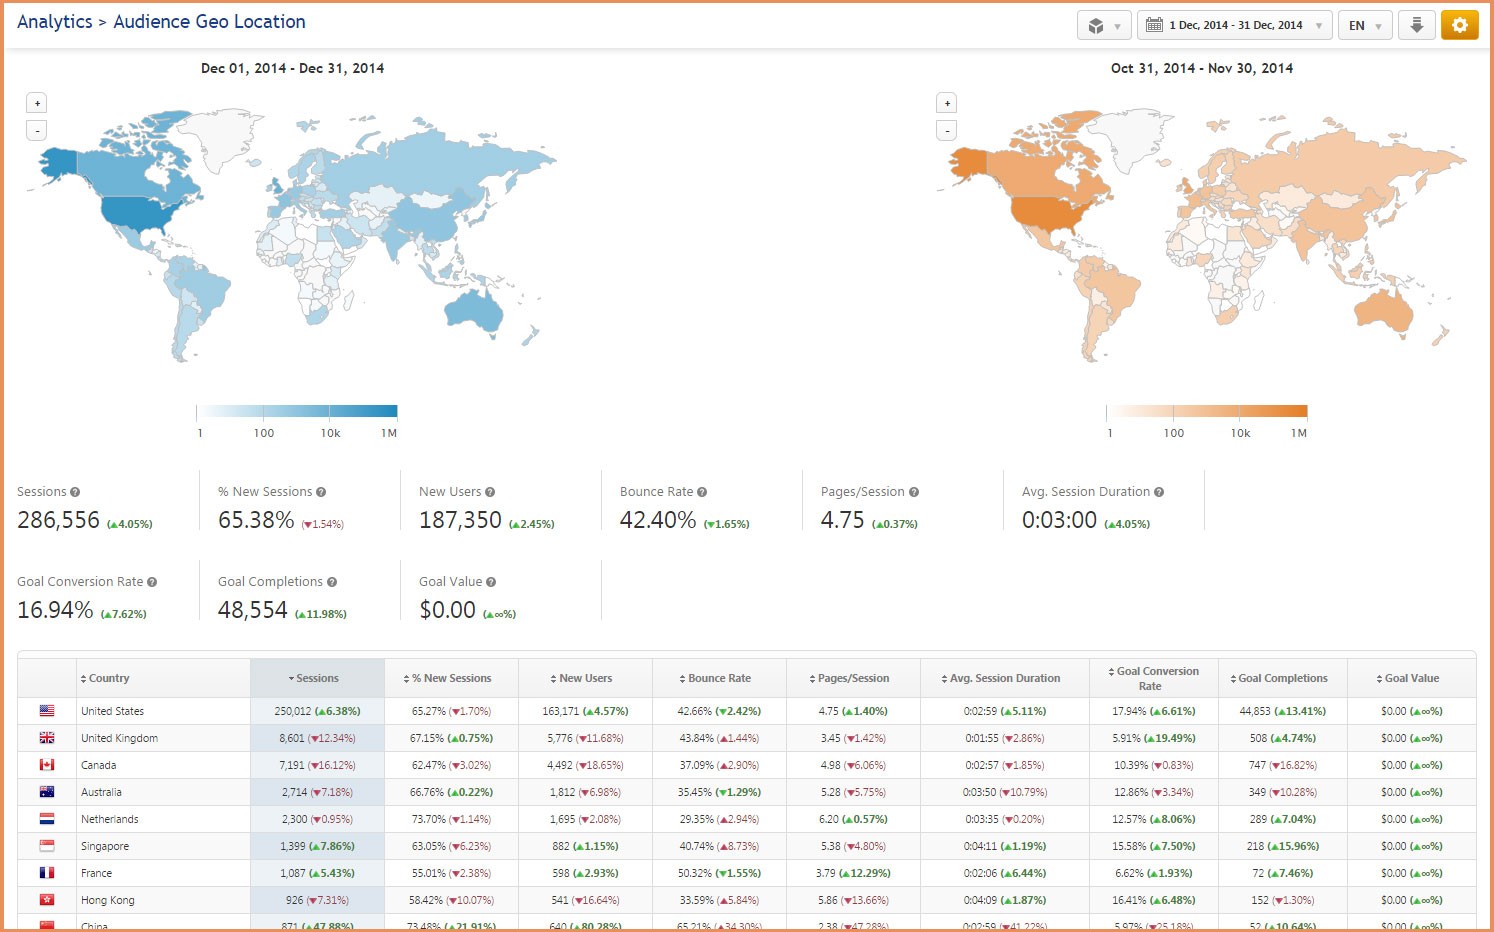
(Image Credit: Rank Ranger)
Device Usage Report
As we have already mentioned, more than 70 to 80 % of website visitors use mobile phones to view your website; you will need to prepare a different report that will include the device usage data. This will allow you to understand if your visitors are using desktop platforms or mobile phones to visit your website. For instance:
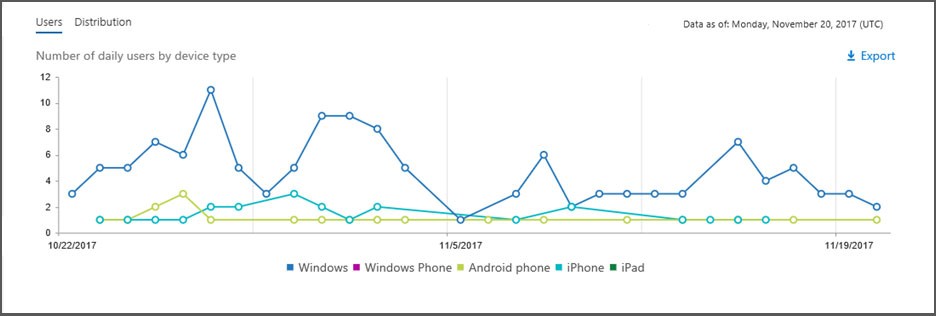
(Image Credit: Microsoft Docs)
Once you have this data at your disposal, you can further optimize your website according to the highly-used device and get more customers to your website. This will allow you to customize UX accordingly to the device report, and you will generate more traction for your business.
How to Write the Perfect Website Analytics Report?
Now that you understand that website analytics is important and what elements to include in your website analytics report, you also need to take a look at how to create the perfect analytical report for yourself. Analytical reporting is an art, and here are some steps to get you started.
Use Digital Platforms
Instead of going for the more traditional analytical reporting templates, you can utilize the modern-era digital technologies at your disposal and make the best of these platforms. You can easily create your analytical report on a Word or Excel file. Still, if you decide to go with a digital dashboard, you will be allowed to use previously created templates for your benefit.
These templates automatically fill in a lot of data, and you only have to input a few numbers to get the right report at your fingertips. Therefore, you can eliminate your labor and hours by opting for digital dashboards for analytical reporting.
Go for Visual Charts
Instead of merely adding numbers to your analytical report, you need to involve a few visual charts to understand the obtained metrics and insights better. It is a well-known fact that visual charts help you better understand any data set, and you can apply the power of visual charts to help you gain a better understanding of your website’s analytical reports.
This way, you will be able to quickly identify the differences between different values without having to go through the entire data set and compare every single value manually.
Segmentation Is Necessary
You can create a simple analytical report with cursory analysis. Still, if you want more data at your fingertips, you will have to go for segmentation for every single metric and value. This means that when you create a “device usage” report, you can also segment the values according to location and age.
Moreover, you can further segment it according to devices and sources of traffic when you get demographics data. Segmentation is necessary to understand the data in detail, and it will allow you to gain useful insights from raw data.
We hope that you found this article useful.
If you want to know more interesting about your site health, get personal recommendations and alerts, scan your website by Diib. It only takes 60 seconds.
SEO Report
If you are trying to increase your SEO ranking in Google search results, you will also have to invest your time in coming up with the right SEO report for your website analytics report. This report should contain how effective your link building efforts have been in the past and if you are getting the right traffic with these links.
In addition to including information about different link building efforts on your website, you will also report about different keywords for your website and see if those have been helpful to increase your SEO rankings or not.
The keyword analysis report is sometimes viewed as part of the SEO report. It measures each keyword’s engagement and how effective it was in getting the customers towards your respective pages.
These reports rely on your website traffic sources or origins and see whether or not your customers are using the same keywords used on your website to get to your landing page. This way, you can further optimize your keywords and SEO link building efforts to get the right amount of traction and traffic for your website. The image below shows an example of a SEO Report:
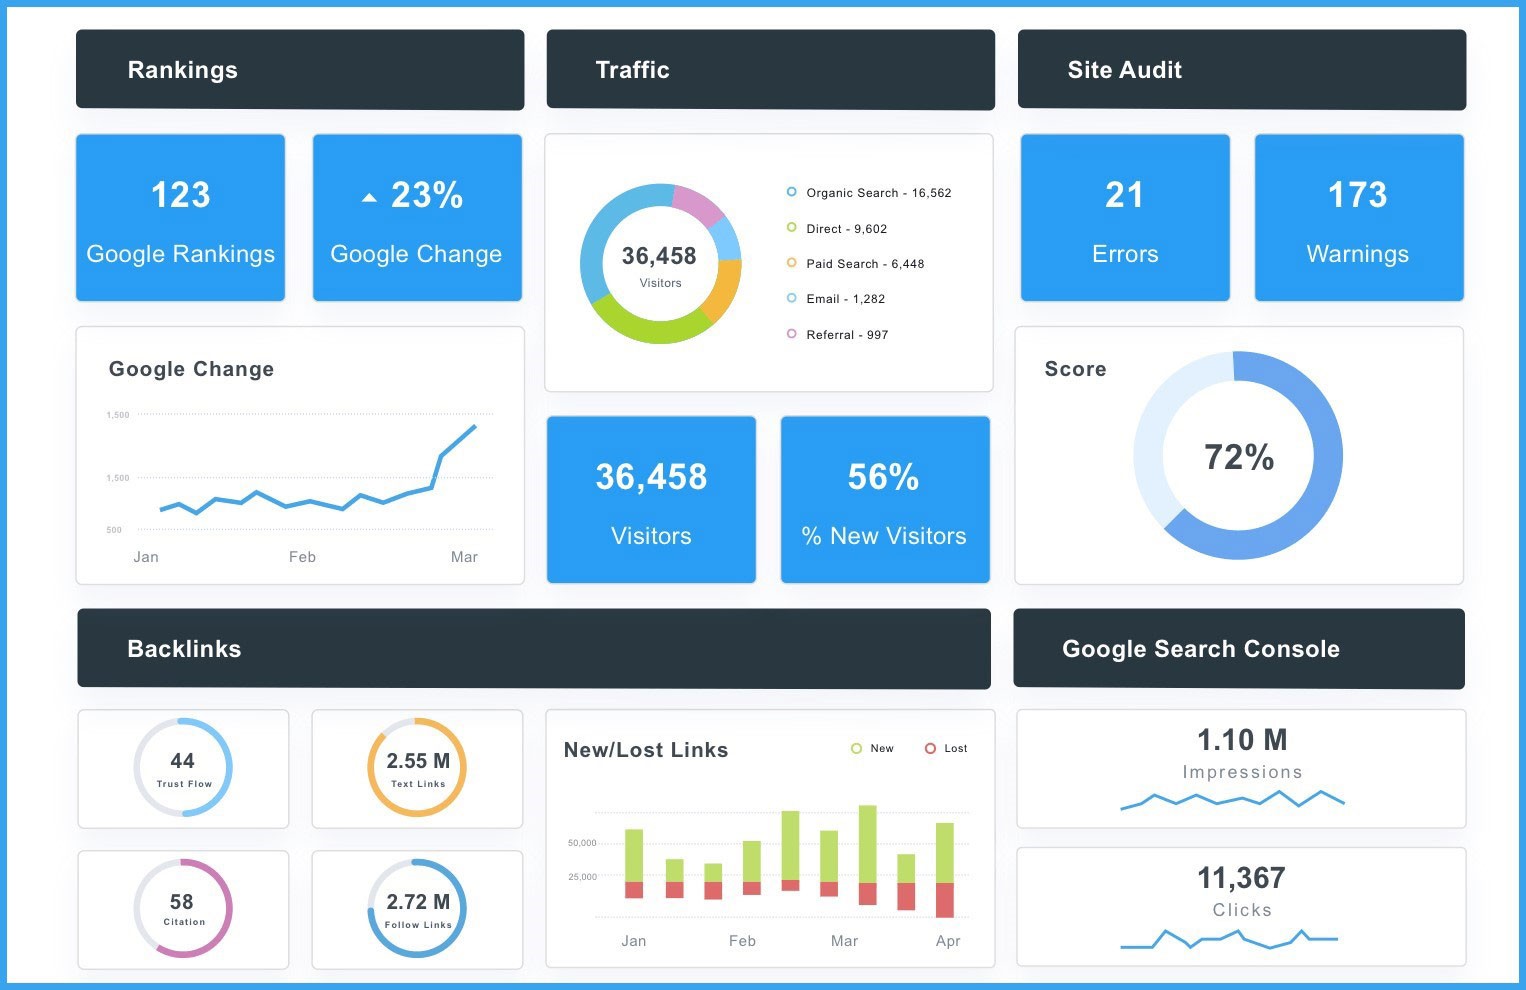
(Image Credit: AgencyAnalytics)
How to Report Websites to Google?
There may be times when you will find yourself compelled to report a website to Google. Why? The website may be offering false information, or it may be offering offensive and hateful content against a group. Therefore, you need to understand how to report a website for false information or hateful content?
If you want to understand “how to report a website for false information?” you should know that it is extremely simple. All you have to do is submit that website link to Google Support. Moreover, the answer to “how to report a website for inappropriate content?” is also the same, and all you have to do is report that website to Google using the right platform.
If you come across inappropriate content on some website, and you want to learn “how to report a website for inappropriate content?” you can submit that link to Google Support. Google staff members will verify whether or not the website contains inappropriate content and will remove it in case of any violations.
Summary
If you want to take your website and your business to the next level, you will have to rely on analytical reporting every now and then. No business or website can survive without the help of the right analytical reports, and you need to understand how your current efforts are doing for your website.
It doesn’t make sense to keep working hard for your website if it is not bringing home the desired amount of traction and traffic. Therefore, an analytical report will help you understand your website’s high-ranking areas and familiarize you with the low-ranking pages and elements of your website.
This will enable you to optimize your website according to your customers and their respective user journeys. You will be able to slowly fine-tune your website and digital presence with the help of these insights. Additionally, you will also be able to increase your SEO rankings and Google search result rankings if you understand how to perform the right keyword analysis and include it in your analytics report to understand your customer behavior better.
Diib®: Understand Your Website Reports
So, if you are tired of trying everything to increase your SEO rankings, but nothing has worked, it is time to utilize the power of website reporting to your advantage. These reports can help you step forward in the right direction with data-driven strategies and techniques. You will be able to build new strategies according to the collected insights, and you will see better results than before. Diib Digital gives your comprehensive yet understandable metrics designed to improve your website ranking, speed and overall performance.
Here are some of the features of our User Dashboard that set us apart from the crowd:
- User experience, specifically mobile users
- Bounce rate monitoring and repair
- Social media integration and performance; local search included
- Broken pages where you have backlinks (404 checker)
- Keyword, backlink, and indexing monitoring and tracking tools
- Mobile speed optimization
- Technical SEO monitoring
Click here for your free scan or simply call 800-303-3510 to speak to one of our growth experts.
FAQ’s
These tools allow companies to collect and analyze data in real time. This is the best way to get the most up-to-date and accurate information regarding daily operations. This allows for intervention before there are negative impacts to your website health.
To create a excellent user experience you should monitor the following:
- The total page load time
- Backlinks including broken links
- Uptime
- Database performance
- Your audience location geographically
- TTFB or time to first byte
Website monitoring is making certain that users can interact with a web page as you want them to. It is used to make sure that a website’s performance, uptime and functionality is going as expected.
There are a few tools you can use to track your website traffic for free, such as:
- Google Analytics tracks many factors of your website including website traffic.
- Alexa the website not Amazon Alexa.
- GoingUp! which is geared towards those who have online businesses.
Digital marketers should put extra care into tracking these three factors of website performance: bounce rate, unique visitors, and average time on page.


One thought on “Website Reporting: Your Guide to Analysis and Stats”