11 min read


What is the Pingdom Test Tool
SolarWinds is the current owner of Pingdom, which is based in Sweden. The company offers a range of services including page speed monitoring, server monitoring, uptime monitoring, visitor insights and transaction monitoring. You may already be familiar with the free website speed Pingdom test tool. This has become an extremely popular tool within the WordPress community. The tool is extremely easy to use as opposed to the wide range of complicated alternative tools available.
To use the service, you need to navigate to your Pingdom tools login. If you do not have an account, a free trial is available so you can see how the tools work. You can then test your website speed from your choice of seven locations. Pingdom strategically placed its locations on five different continents all over the world in:
- Europe: Frankfurt Germany and London United Kingdom
- Asia: Tokyo Japan
- North America: Washington D.C. and San Francisco United States
- South America: São Paulo Brazil
- Pacific: Sydney Australia
Pingdom Tools Speed Test
Using the popular Pingdom tools site speed test is simple. Start by entering the URL for your website. Select a test location. You need to choose the closest location for your target audience. Click on Start Test. Optimizing the speed score for your website is not considered as important as the load time for your site. Whenever possible, you want your website to load in less than two seconds. Your load time changes according to the type of tool you use because the metrics are different including:
Onload Time
This is when your page is completely processed and all of your resources including images are fully loaded. Certain events are not included despite the importance to your page such as JavaScript.
Fully Loaded Time
When your page is no longer loading any content, it is called fully loaded time. This is always slower than your onload time. Onload time is exclusively used by Pingdom tools. Many of the other tools enable you to choose from different metrics. Although this is a good metric, you need to know the way your load time is calculated is different. This means your Pingdom load time is almost always faster than if you used another tool and this makes comparison difficult. The image below shows Pingdom’s speed test tool:
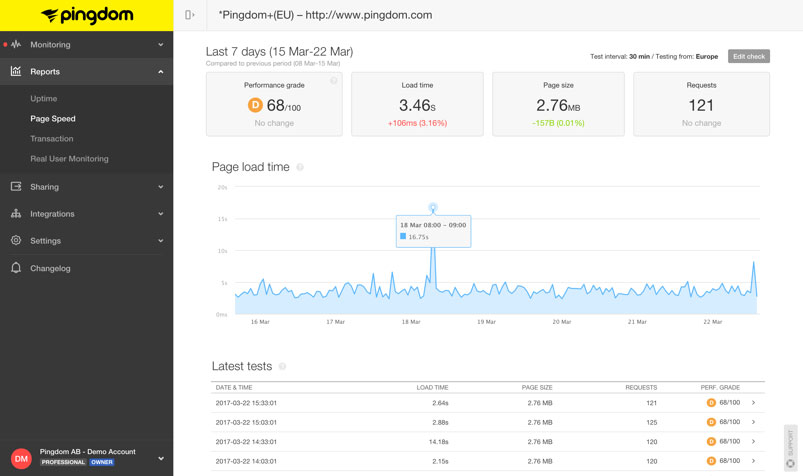
(Image Credit: Pingdom)
Pingdom Com Tools Content and Request
You are provided with information regarding your content and requests with four different Pingdom tables. All of your assets will be listed in groupings depending on the type including HTML, CSS, scripts and images. This information is helpful for eliminating any obvious issues. If you have loaded 20MB of images on your page, your images most likely require optimization. If you have loaded 2MB of JavaScript, there is a good chance you are not using your scripts efficiently.
The table for requests by content type shows how many requests are made by your website. This is a good opportunity for optimization. If you have a lot of separate scripts, you should consider sequencing some or all of them into one script. The information you receive for the table for content size by domain is similar in regards to your content origin. You can use this information to quickly determine the amount of external content loading on your website.
Your content should mainly be loaded from a CDN or local source. If a lot of your content is loading from off-site sources, there is a risk your website will be slowed down while waiting for slower responses from other sites.
Uptime Monitoring
Uptime monitoring helps determine the reliability of your host. This is the most basic Pingdom monitoring available. The monitoring uses a graph combining the downtime experienced by your website and your average response time. If your website goes down, you have the option of setting up alerts in real-time. Your alerts are received through email. Depending on your issue, you can send alerts to different individuals. You can select your check interval when adding an uptime check from one to 60 minutes. For example:
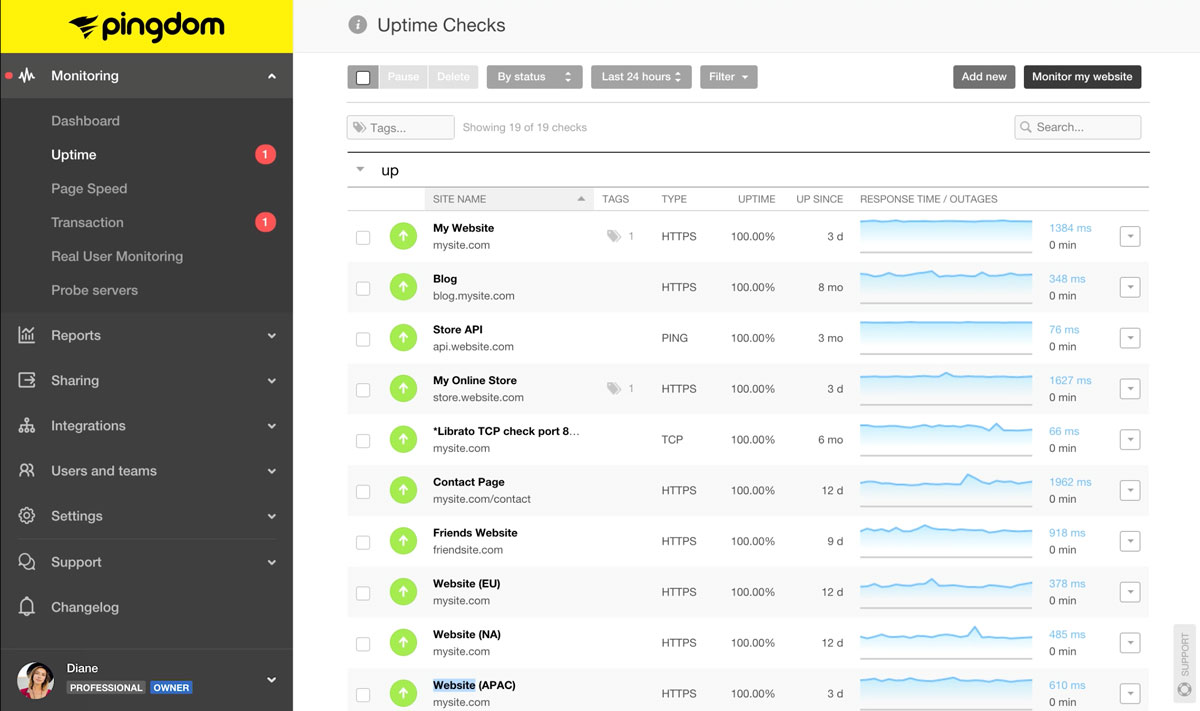
(Image Credit: Pingdom)
Visitor Insights
In most instances, page speed tests are artificial. This is because your website is either loaded in your browser or through a test initiated through an external service like Pingdom tools. In some cases, what is occurring in reality does not show up as part of your testing. For the most part, Pingdom does offer you accurate results. Part of the real user monitoring system offered by Pingdom is called visitor insights. This is similar to Google Analytics because you receive a little code to add to your website.
Once your code is added, real data begins to appear. You can determine the actual loading time of your website for visitors instead of an automated bot or yourself. Real data provides you with much better insights than test locations because your visitors are located from across the globe. There are options for setting the conditions for your load time including frustrated, tolerating and satisfied visitors. This enables better segmentation of your view.
When you collect real data, you can make a good comparison with the Pingdom com tools. You can determine the different connection speeds of your website, loading using different devices and loading for users from a variety of locations. By combining all of these variables, you receive an accurate picture of your website loading times in the real-world. For instance:
You Might Also Like
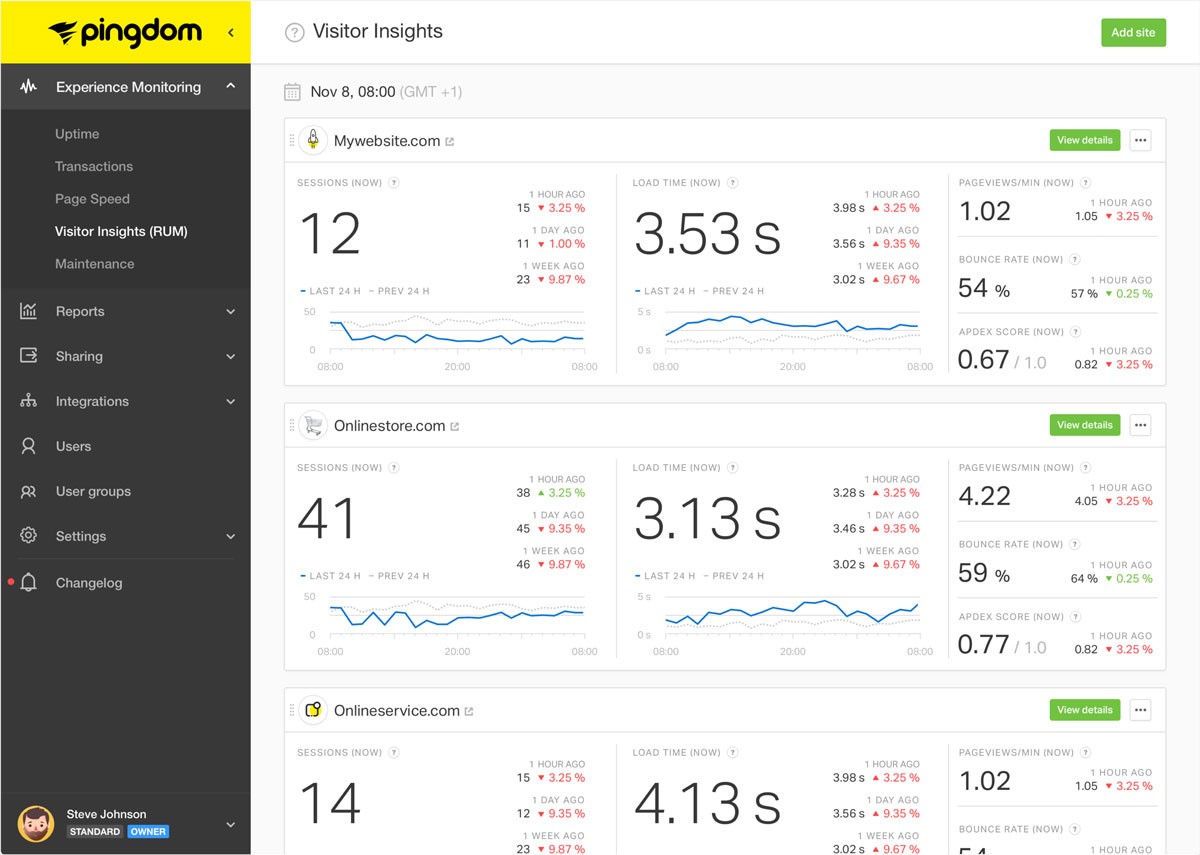
(Image Credit: Pingdom)
Transaction Reports
One of the most powerful features available through Pingdom is the transaction reports. This enables you to make certain your pages are working smoothly and your visitor interactions include multiple actions. This is invaluable for interaction-based websites including SaaS applications and eCommerce sites. A good example is setting up Pingdom for monitoring the checkout process of your eCommerce store. If there is an issue, you receive an instant alert to help prevent any loss of revenue. For example:
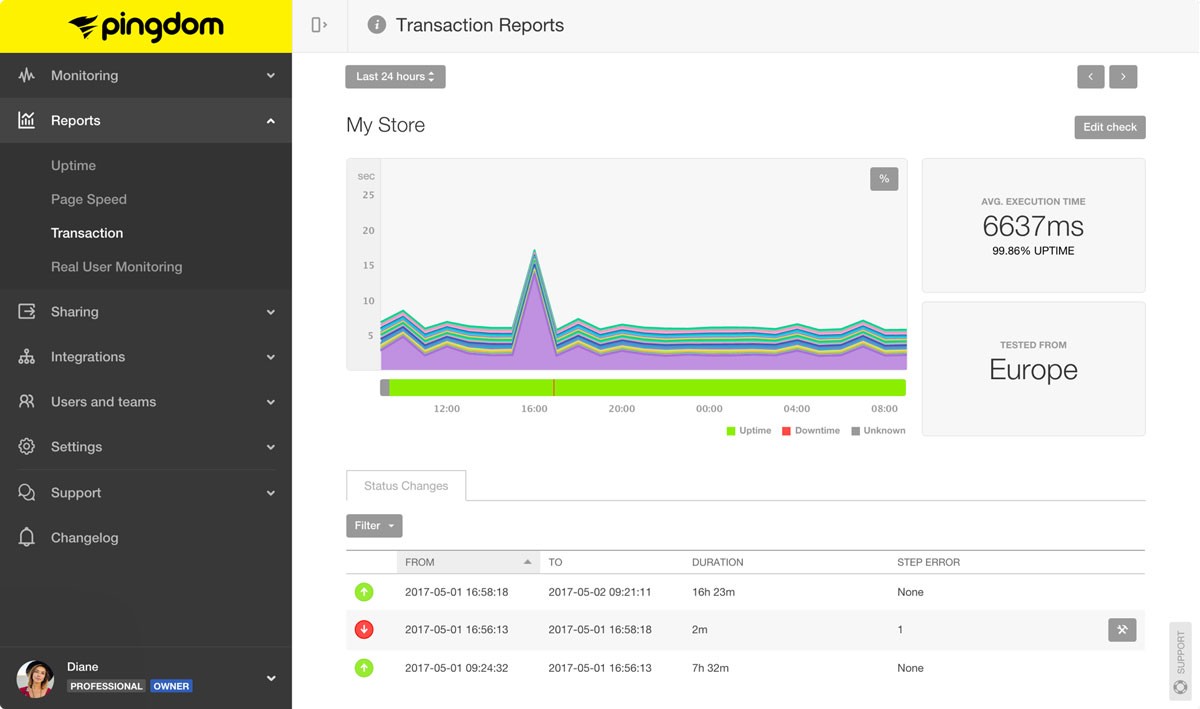
(Image Credit: Pingdom)
The idea is using a simple editor for informing Pingdom how your website is navigated and the best way to check your results. Pingdom can be instructed to load your homepage, fill in one of your search fields, make certain you receive a 200 status code and then provide you with the results. If you are somewhat experienced with web development, a transaction sequence can be set up through your back-end editor. As you continue, you will receive suggestions from Pingdom.
The recommended tracking actions are based on your site. You can also have every link scanned automatically for tracking your online clicks as transactions.
Test your SEO in 60 seconds!
Diib is one of the best SEO tools in the world. Diib uses the power of big data to help you quickly and easily increase your traffic and rankings. Diib will even let you know if you already deserve to rank higher for certain keywords. As seen in Entrepreneur!
- Easy-to-use automated SEO tool
- Keyword and backlink monitoring + ideas
- Speed, security, + Core Vitals tracking
- Intelligently suggests ideas to improve SEO
- Over 500,000 global members
- Built-in benchmarking and competitor analysis
Used by over 500k companies and organizations:
Syncs with 

Page Speed Reports
Page speed reports are the equivalent of the free Pingdom tool available on the site. The difference is everything is combined with your historical data. This is a good option for finding slowness related to your code or nasty trends. The default for Pingdom is testing the performance of your site automatically every 30 minutes. This means the data is obtained from 48 checks every day.
You receive a lot of data points and can see the changes in your load times during different times of the day. You might learn your website has a slight drag when your automatic daily scan is run by your security plugin or during peak hours.
Alerts
You immediately receive a basic alert system from Pingdom. You can get SMS messages, basic app notifications and emails. Your alerts will be received within minutes. Pingdom also provides built-in integrations for specific apps. You can also connect to any app by using a tool to set up your integrations. If you are part of a team, multiple team members can be added with different alert policies for each person.
You have a wide variety of options for notification in the event of an issue. You will receive quick notifications for any issue regarding all transactions you are monitoring and downtime. The image below shows where to go to set up alerts on Pingdom:
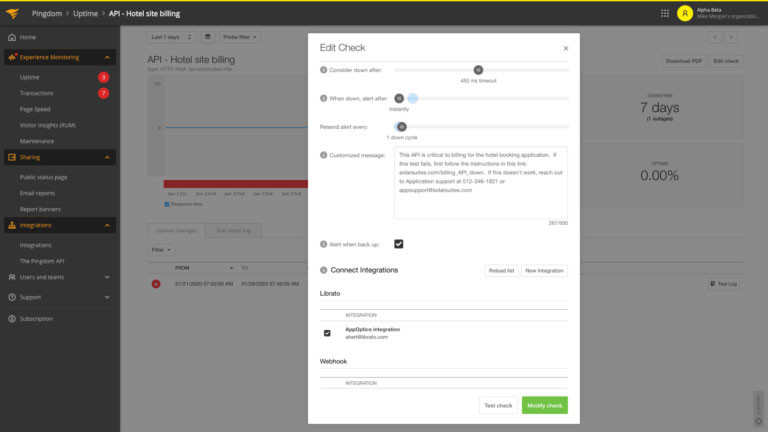
(Image Credit: Pingdom)
Pingdom Pricing
You can take advantage of the free 14-day trial offered by Pingdom. You do not need a credit card to test everything. After your trial, you can choose from two paid services. The prices for both scale according to your usage. Pingdom pricing for both synthetic monitoring and real user monitoring is $10 per month. Your cost scales according to specific metrics. Pingdom has calculators to help you determine your exact cost. Both real user and synthetic monitoring are included with your free trial.
Synthetic Monitoring
Synthetic monitoring includes uptime monitoring, page speed monitoring and transaction monitoring through Pingdom testing. Synthetic monitoring is often referred to as proactive monitoring because the actions of your users are simulated as opposed to using the actions of real users. This means you can potentially detect any issue before it becomes a problem for your visitors. You can determine if anything is inaccessible or too slow, test recent changes and features and improve your site proactively.
You can test out the functionality of any new pages such as adding support for a new payment method prior to public release. The majority of users will not remain on the first page once they arrive at your site. Visitors often interact with many of the elements on your website. For this reason, you need to be certain everything is working correctly. You can test numerous website components to make certain they are performing in the manner expected by your actual users.
Pingdom can be set up for monitoring transactions with multiple steps from beginning to end. You need to have some experience with HTML and knowledge of programming to leverage the transaction monitoring feature of Pingdom. Pingdom provides you with an editor for specific event sequences and performing customized testing of the average journey of a typical visitor across different areas of your site. You can test the steps followed by your users including:
- Logging in
- Visiting your homepage
- Navigating to a specific section
- Clicking to view numerous items
- Adding items to visitor shopping carts
- Checking out with a credit card
If all of these steps are not completed, your business can be negatively affected. All of the data received from your testing is compiled by Pingdom and placed in a report. You can then access your performance level and make any improvements necessary.
Real User Monitoring
You need to track the interactions of your actual visitors with your website regularly to supplement your synthetic monitoring data. This is supported by Pingdom with capabilities for real user monitoring. You begin by adding a little JavaScript to your site the same way you would using Google Analytics. You can then begin collecting real metrics from actual visitors including identifying performance trends and the load speed of your resources including images and HTML files.
Real user monitoring is important because it enables you to see the issues facing your visitors every day. Unless your users used your support services to make a complaint, you would be blind to these issues without real user monitoring. The chances are good there are a lot of users not submitting a complaint in comparison to each user that does. Unfortunately, the majority of your users will leave your website and shop with one of your competitors as opposed to making a complaint.
You can use real user monitoring to detect slower load times and errors before you lose both potential and current customers. You can use visitor locations to break down your performance metrics. This will show if one country is loading slower than another. Setting performance goals enables you to receive alerts if Pingdom determines your visitors are not receiving the intended level of service. For example:
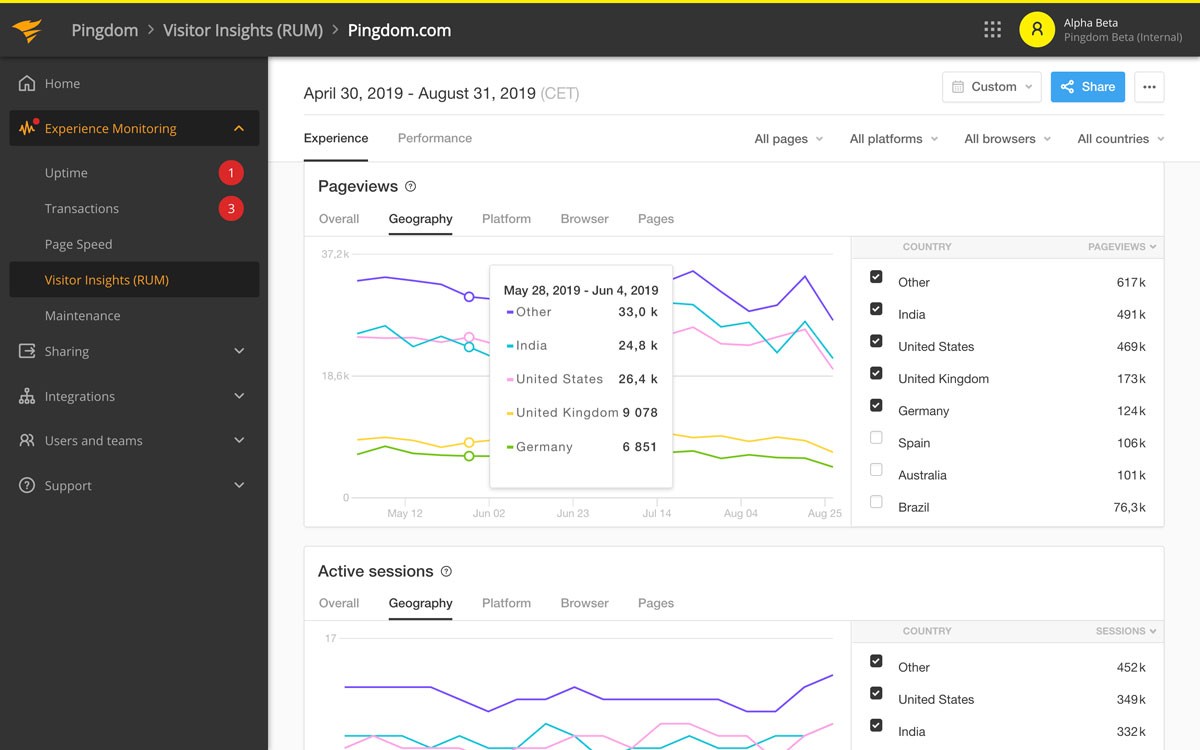
(Image Credit: Pingdom)
Pingdom Mobile App
Pingdom offers a useful and free mobile app for both iPhone and Android users. The app works well and has good user reviews. This is a good option for receiving notifications and making certain you remain updated regarding your website no matter where you are. You can view basic data with the mobile app including uptime checks and response time. The app is simple to use and a great compliment to Pingdom.
We hope that you found this article useful.
If you want to know more interesting about your site health, get personal recommendations and alerts, scan your website by Diib. It only takes 60 seconds.
Waterfall Analysis
Pingdom offers a waterfall analysis enabling you to take a deeper look at all of the HTTP requests received by your website. A good example is the Pingdom summary box. If you have 60 HTTP requests, this section will contain 60 entries. There is one for each individual request. Developers frequently use this tool to visually understand the way a website is loading so they can find the issues or bottlenecks. You will receive even more information simply by clicking on the expander arrows to view details for every request.
On your left, there is an icon indicating the content type requested. If you do not receive a 200 class response, an alert icon will appear. Hover your mouse over the icon and you will receive additional information. The next item is the request size and the request URL. The horizontal bar graph shows how and when your resources are loaded. The farther to the right your bar, the later your resources are loading. Your loading time is indicated by the length of your bar. The break down includes:
- Connect
- Wait
- Send
- Blocked
- SSL
- Receive
- DNS
Watching your connection sizes regularly is important for your local resources. If your website is well-configured and your connect times are lengthy, there is most likely an issue with your host. Look for longer bars indicating an issue with your site loading or external resources with other metrics such as a lengthy DNS. These issues need to be eliminated. If you have a WordPress site, this tool allows you to find themes or plugins causing your website to run slower.
There is a search box located on top enabling you to search for specific plugins or themes. If your waterfall analysis indicates an issue, you should consider changing the plugins or themes negatively affecting your website with something more optimized for performance. Here is an example of a waterfall chart by Pingdom:
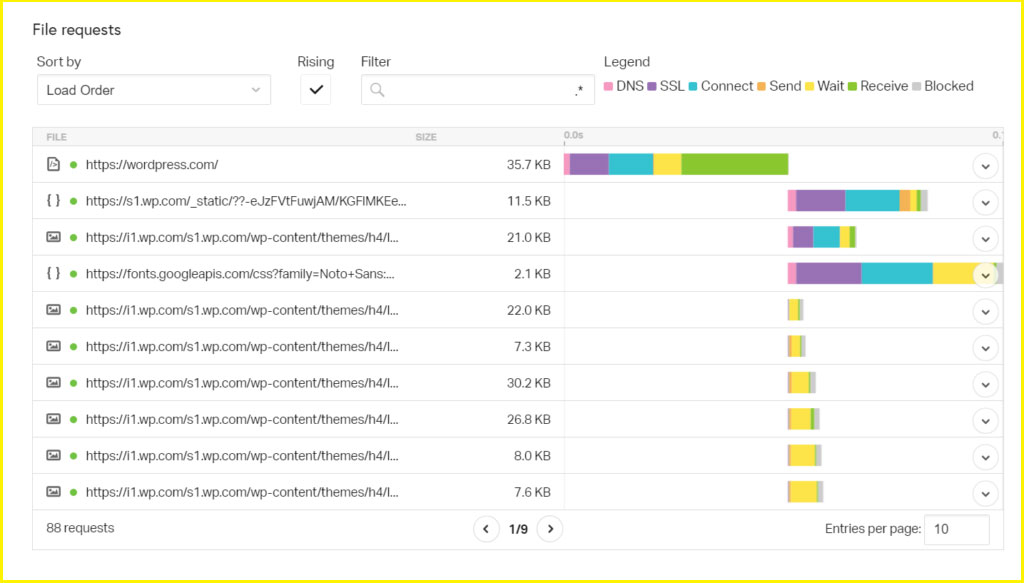
(Image Credit: Webscoot)
Pingdom Response Codes
HTTP status codes or response codes are similar to a little note from your web server that you receive on top of one of your web pages. This is a web server message telling you how everything went when your request was received for viewing your page. The most common messages include:
200
This message means everything is fine. You receive this code when your resources or web page performs exactly the way it should.
301
This means the resource you requested has been permanently moved. You receive this code when a resource or web page is replaced permanently with another resource. This code indicates a permanent URL redirection.
404
This code tells you the resource requested was not found. This is the most common error code you will receive. It means the resource you requested no longer exists or the server might never have existed.
Diib®: Pingdom-like Tools at Your Fingertips!
No matter the tools you choose to use in monitoring your website, Diib Digital can give you the critical metrics you need to decide what is working and what isn’t. Our easy to read User Dashboard will show you minute-by-minute technical SEO metrics, a daily website health score along with hundreds of other bits of information you need to make daily business decisions. Here are just some of the features you’ll quickly grow to love:
- Keyword, backlink, and indexing monitoring and tracking tools
- User experience and mobile speed optimization
- Bounce rate monitoring and repair
- Social media integration and performance
- Broken pages where you have backlinks (404 checker)
- Technical SEO monitoring
Click here for your free scan or simply call 800-303-3510 to speak to one of our growth experts.
FAQ’s
Pingdom is a global performance and availability monitoring service for websites, apps and servers.
The Pingdom Javascript library is necessary in order to collect data, which means, you need to add the snippet provided to all pages you wish to monitor. No variable customer data is needed.
When running your WordPress site through Pingdom it generates a performance grade, total load time, number of requests and the total page size on your website.
Response time is calculated as the time it takes to perform an HTTP GET to the specific URL. This is calculated in 3 parts: time to first byte. Time to receive headers. Time to load HTML of a site.
This is an alert system where you receive a message or alert the minute an issue is detected and it also lets you know when the normal service is restored.